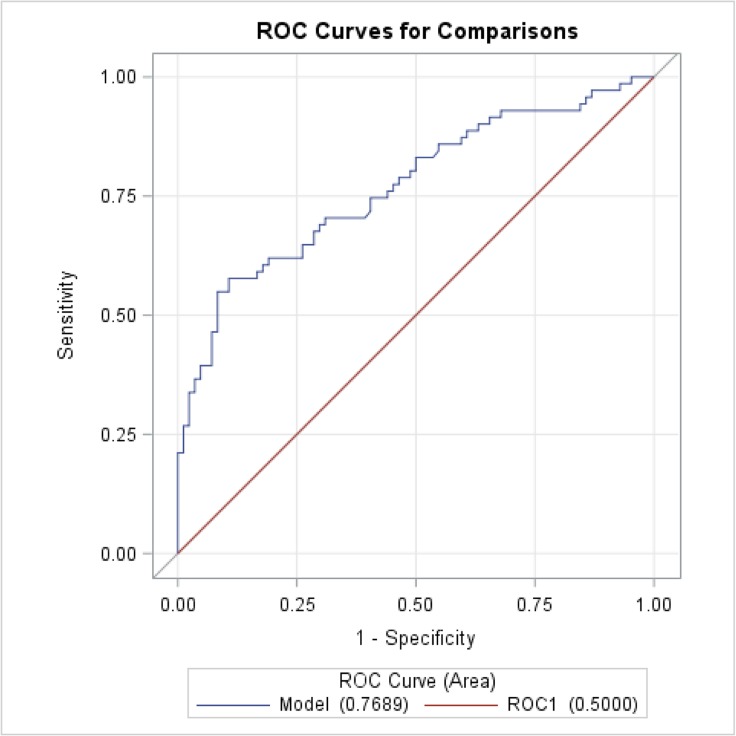
Fig. 5.
ROC curve of ICTP. ROC analysis of the ICTP ability to separate AAA patients and healthy persons. ICTP is the last candidate from our biomarker panel to be a part of the multi parameter predictive model of AAA growth and rupture risk. Model: ICTP, C-terminal telopeptide of type I collagen, AUC = 0.7689

