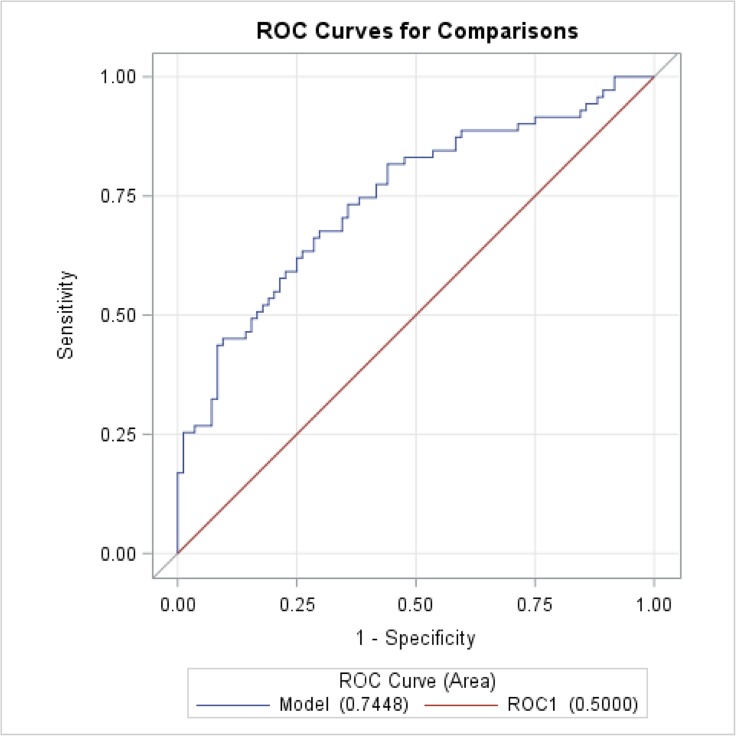
Fig. 6.
ROC curve of PIIINP. ROC analysis of the PIIINP ability to separate AAA patients and healthy persons. Despite relatively satisfied AUC value, PIIINP was not chosen by created multi parameter model of AAA growth and rupture risk. Model: PIIINP, procollagen type III N-terminal peptide, AUC = 0.7448

