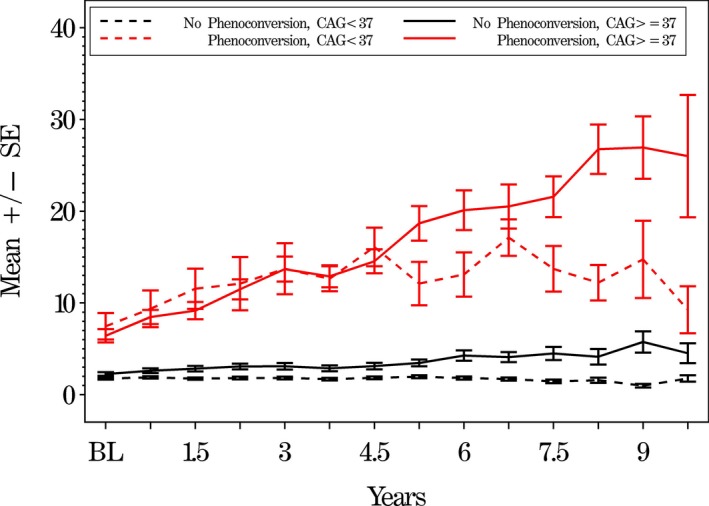
Figure 1.

Mean independent rater (IR) total motor UHDRS scores comparing subjects by motor phenoconversion and CAG status. Mean UHDRS motor scores (higher scores are worse) on the y‐axis versus time in years on the x‐axis of those who phenoconverted with ≥ 37 repeats (solid red line) and those PGDs who phenoconverted with < 37 repeats (dotted red line). Black lines show subjects who have not phenoconverted and have ≥ 37 repeats or < 37 repeats, respectively. The error bars show the standard error of the mean.
