
Figure 3.
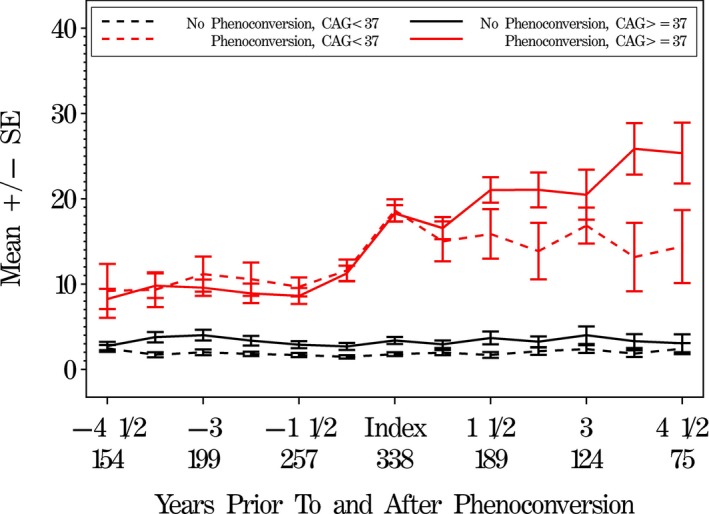
Mean independent rater (IR) total motor UHDRS scores comparing prior to and after motor phenoconversion. IR total motor scores (higher scores are worse) prior to and after phenoconversion, by phenoconversion and CAG status (matched subjects). The phenoconversion visit is designated as the index visit. For each of the four conversion/CAG groups, we look both backwards from phenoconversion and forward after phenoconversion. Numbers on the x‐axis represent years prior to and after the index visit, along with total sample size for each time point.