
Figure 3.
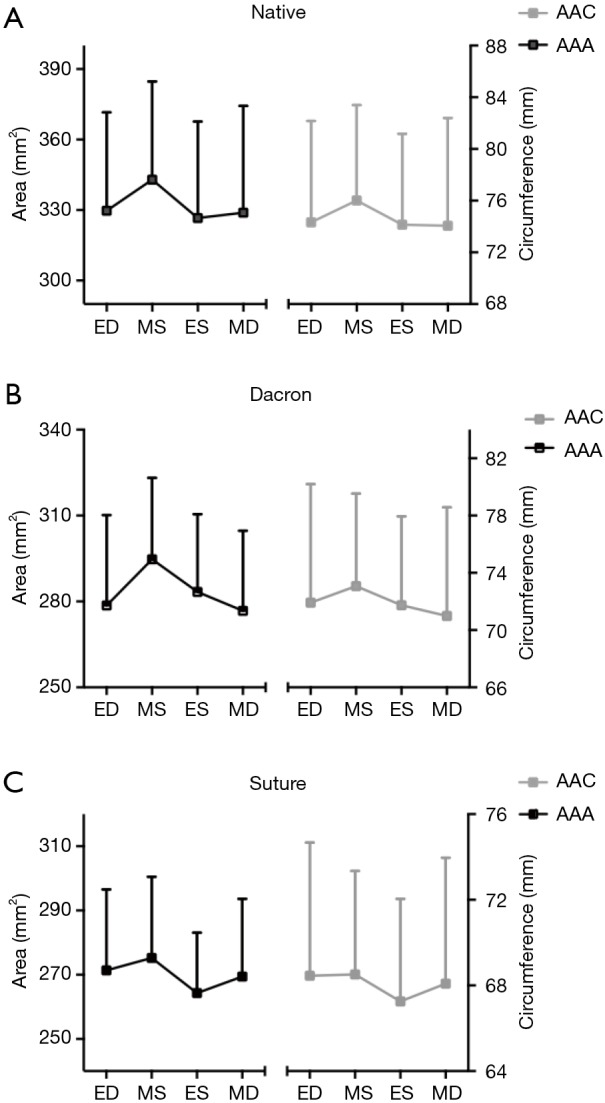
Aortic annulus area (AAA) (left) and aortic annulus circumference (AAC) (right) presented at four defined time points throughout the cardiac cycle (ED, MS, ES, MD). Mean + standard deviation. (A) Native group; (B) Dacron group; (C) Suture group. ED, end-diastole; MS, mid-systole; ES, end-systole; MD, mid-diastole.