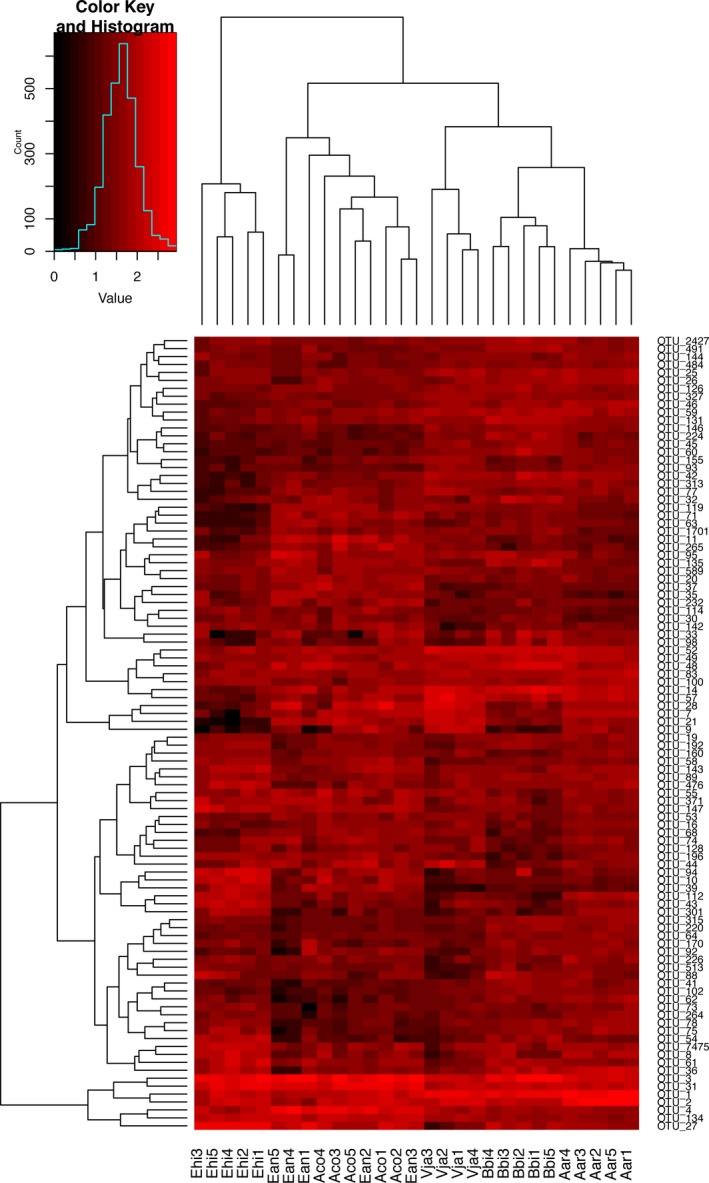
Figure 2.

Heatmap depicting the relative abundance of the most 100 differentially abundant Operational Taxonomic Units (OTUs) in six plant rhizosphere soil sample. Dendrogram linkages and distances of OTUs are not phylogenetic, but based upon reads number (log transformed) of OTUs within the samples. Legend and scale shown in the upper right corner of the figure represent colors in heatmap associated with the relative abundance of OTUs (cluster of variables in Y‐axis) within each plant and soil sample (X‐axis clustering). Aco, Ageratum conyzoides; Ean, Erigeron annuus; Bbi, Bidens biternata; Aar, Artemisia argyi; Vja, Viola japonica; Ehi, Euphorbia hirta; Con, Bulk soils. The corresponding taxonomic profiles for each OTU were presented in Supporting Information Table S6
