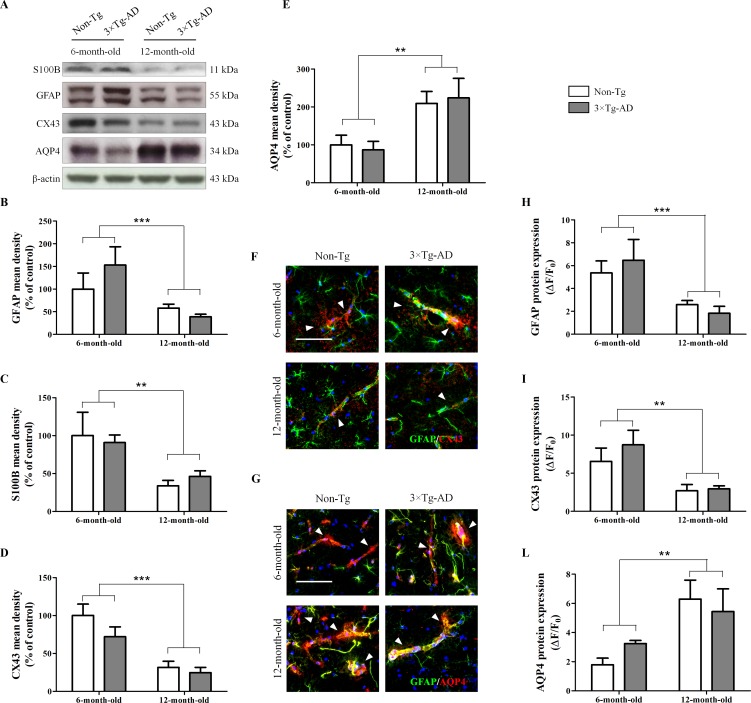
Figure 1.
Effects of aging on morphology and functions of hippocampal astrocytes. (A) Representative western blots for GFAP, S100B, CX43 and AQP4 and (B, C, D, E) densitometric analyses normalized to β-actin loading control. Results are expressed as means ± SEM of percentage of controls (6-month-old/Non-Tg) (N = 3, in triplicate). (F) Representative fluorescent photomicrographs of CX43 (red) and GFAP (green) in the hippocampal CA1 region of both 6- and 12-month-old Non-Tg and 3×Tg-AD mice. White arrows indicate CX43 mainly expressed in astrocytes enveloping blood vessels. (G) Representative fluorescent photomicrographs of AQP4 (red) and GFAP (green) in the hippocampal CA1 region of both 6- and 12-month-old Non-Tg and 3×Tg-AD mice. White arrows indicate AQP4 expressed in astrocyte end-feet surrounding blood vessels. Fluorescence analyses of (H) GFAP, (I) CX43 and (L) AQP4 are expressed as ΔF/F0 = [(F− F0)/F0], where F is the mean fluorescence intensity and F0 is the mean background fluorescence. Nuclei were stained with DAPI (blue). Scale bar 50 µm. Statistical analysis was performed by two-way ANOVA followed by Bonferroni’s post hoc test (**p < 0.01; ***p < 0.001, 6-month-old vs 12-month-old).

