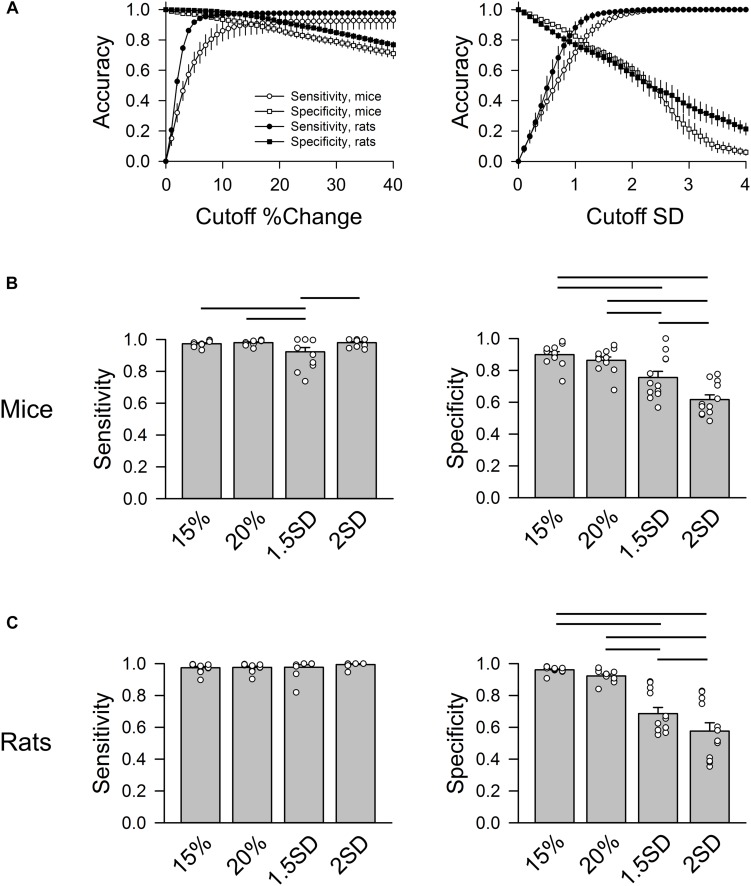
FIGURE 4.
Group data of sensitivity and specificity in mice (n = 3) and rats (n = 3). (A) Accuracy of sensitivity (circles) and specificity (squares) at different % change cutoff values (left) and SD cutoff values (right). For % change, the sensitivity and specificity curves intersect at 10–20% change. For SD exclusion method, the sensitivity and specificity curves intersect at ∼1 SD. (B) Group data of four cutoff values (exclusion criteria) in mice: 15%, 20%, 1.5 SD, and 2 SD showing that 1.5 SD exclusion criterion had the lowest sensitivity. 15 and 20% had significantly higher specificity than 1.5 SD and 2 SD criteria. (C) Group data of four cutoff values in rats showing that 15 and 20% had significantly higher specificity than the 1.5 SD and 2 SD criteria. Horizontal bars represent significant difference (p < 0.05) between the two groups.

