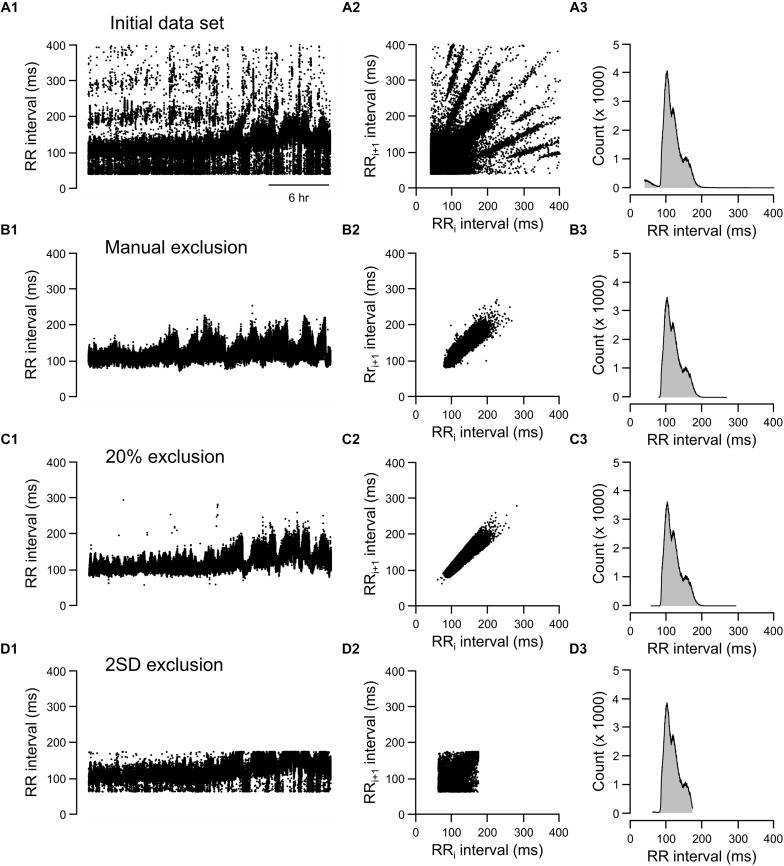
FIGURE 6.
Tachograms, Lorenz plots, and frequency histograms of 24-h data from mouse recording 1 before any exclusion process (A, initial data set), after excluding abnormal RR intervals manually (B, manual exclusion), after excluding all RR intervals that were >20% different from either adjacent RR intervals (C, 20% exclusion), and after excluding all RR intervals that were outside of the 95% confidence intervals (D, 2 SD exclusion). The tachogram, Lorenz plot, and frequency histogram shown in Figure 1 are replotted here (Figure 7A) for ease of comparing the three exclusion methods (manual, 20% change, and 2 SD) to the initial data set.

