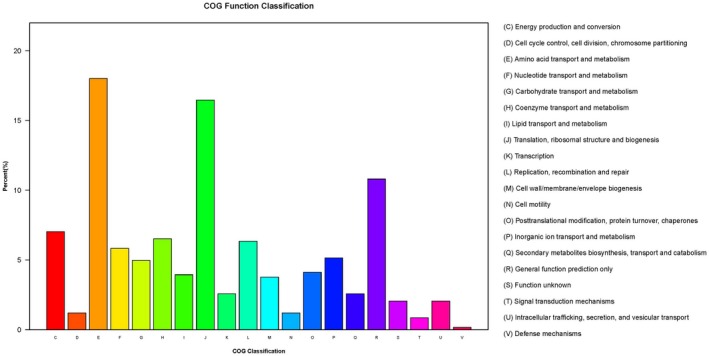
Figure 7.

Distribution of differentially expressed genes (DEGs) between SS1 and GS1 in cluster of orthologous group functional categories. 583 DEGs were mapped to 20 COG categories, 18% of which were related to amino acid transport and metabolism. 16.5% were related to translation, ribosomal structure, and biogenesis
