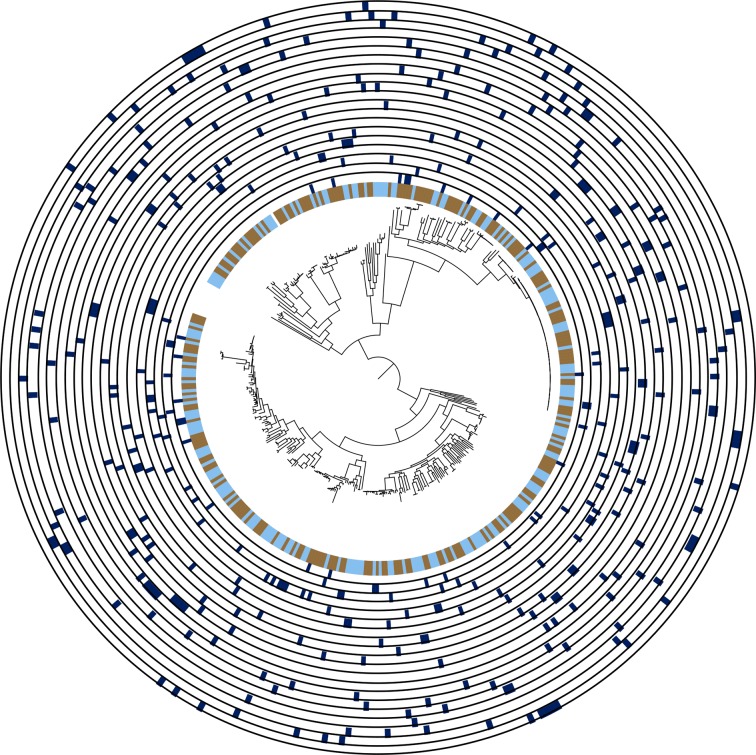
Fig. 3.
Diversity of E. coli in wastewater treatment plants. Maximum-likelihood phylogenetic tree based on SNPs in the core genes for the wastewater collection excluding two cryptic E. coli isolates (n=386). Inner ring shows whether the isolate was from treated (blue) or untreated (brown) wastewater. Further rings show isolates belonging to each wastewater treatment plant (dark blue), from VREW0001 (innermost ring) to VREW0020 (outermost ring).

