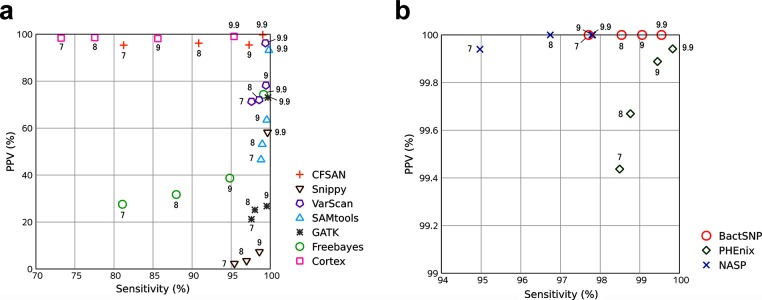
Fig. 2.
Benchmarks using simulated sequence data. PPV and Sensitivity in Table 1(a) were represented graphically (Those in Table 1(b) and (c) are represented in Fig. S1). The values 7, 8, 9 and 9.9 in the graph represent 97, 98, 99 and 99.9 % identity between the reference-root pair, respectively. (a) PPV and sensitivity of SNP callers that exhibited low PPV (<99) in at least one identity. (b) PPV and sensitivity of SNP callers that exhibited high PPV (≥99) in all identities.

