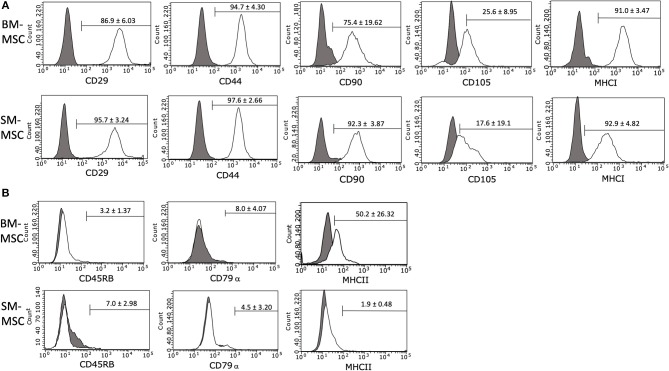
Figure 2.
Flow cytometric histogram analyses of cell surface marker expressions in P2 (A) BM-MSCs and (B) SM-MSCs. The gray lines represent isotype controls and white lines represent respective cell surface marker staining. The mean ± SEM percentage of positive cells is in the corner of each histogram. Each histogram is a representative result of 6 horses.

