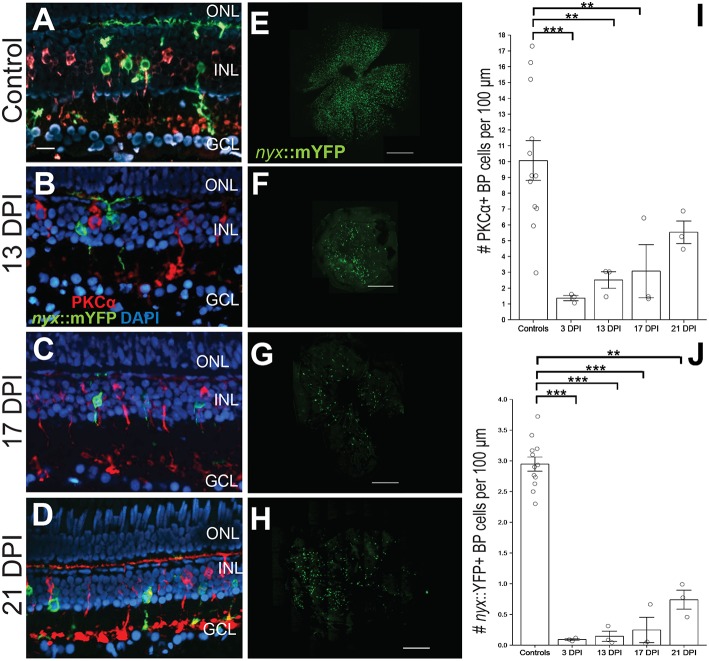
Figure 1.
Emergence of identifiable retinal bipolar (BP) neurons following a chemical lesion selective to the inner retina. (A) PKCα+ and nyx::mYFP+ BP cell bodies occupy the inner nuclear layer (INL), with dendritic trees in the OPL and axon terminals in the inner plexiform layer of control retinas. (B–D) New PKCα+ and nyx::mYFP+ BPs reappear over the time frame of 13 days post-injury (DPI) (B), 17 DPI (C), and 21 DPI (D), and have recognizable apical processes (dendrites) and basal processes (axons). (E–H) Retinal flat mounts of control (E), and regenerated, nyx::mYFP retinas at 13 DPI (F), 17 DPI (G), and 21 DPI (H) showing distributions of regenerated nyx::mYFP+ BP neurons (n = 11) controls, six 13 DPIs, five 17 DPIs, and five 21 DPIs prepared as whole mounts (Supplementary Table 1) and visually inspected for overall distribution of nyx::mYFP BPs. Three controls, two 13 DPIs, three 17 DPIs, and three 21 DPIs were imaged as in (E-H). High resolution images of these retinas are provided in Supplementary Figure 1. (I) Numbers of PKCα+ BPs at 3 (McGinn et al., 2018), 13, and 17 DPI were significantly different from controls (**p < 0.01; ***p < 0.001), while there was no statistically significant difference between controls and 21 DPI (p = 0.246), or for any other post-hoc pairwise analysis (Kruskall-Wallis, Conover's post-hoc analysis; graph shows means ± SEM). (J) Numbers of nyx::mYFP+ BPs remained significantly reduced at 3, 13, 17, and 21 DPI (**p < 0.01; ***p < 0.001), but there was no statistically significant difference for any other post-hoc pairwise analysis (Kruskall-Wallis, Conover's post-hoc analysis; graph shows means ± SEM). Scale bar in A (applies to A–D) = 20 μm. Scale bars in E-H each = 200 μm.

