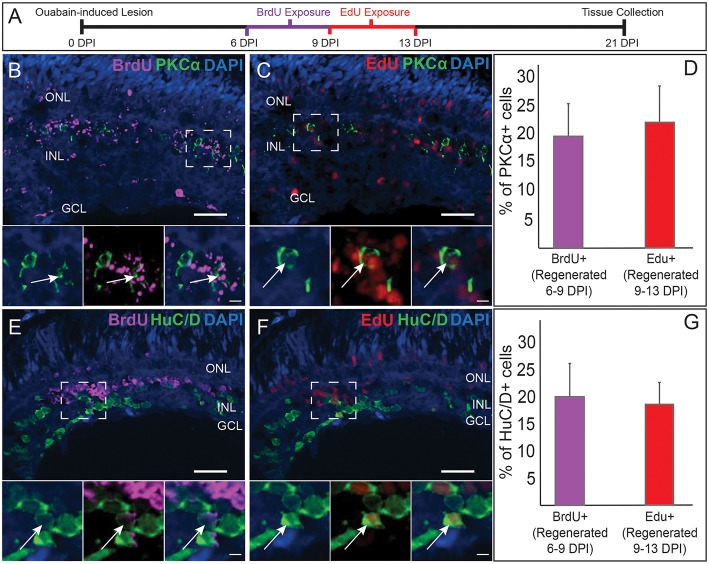
Figure 2.
Comparative birthdating of regenerated PKCα+ bipolar (BP) neurons and HuC/D+ amacrine and ganglion cells following a chemical lesion selective to the inner retina. (A) Timeline and experimental design; DPI, days post-injury. (B) Some regenerated PKCα+ (green) BPs incorporated BrdU (magenta) (6–9 DPI). Higher magnification insets of boxed region show PKCα and DAPI, PKCα, and BrdU, and all channels merged. Arrows indicate BrdU+ PKCα+ BP cell. (C) Some regenerated PKCα+ BPs incorporated EdU (red) (9–13 DPI). Higher magnification insets corresponding to boxed region show PKCα and DAPI, PKCα and EdU, and all channels merged. Arrow indicates EdU+ PKCα+ BP cell. (D) Percentage of PKCα+ cells that incorporate BrdU and EdU at the indicated timeframes (means ± s.d.; n = 3). (E) Some regenerated HuC/D+ (green) neurons incorporated BrdU (magenta) (6–9 DPI). Higher magnification insets corresponding to boxed region show HuC/D and DAPI, HuC/D and BrdU, and all channels merged. Arrow indicates BrdU+ HuC/D+ cell. (F) Some regenerated HuC/D+ BPs incorporated EdU (red) (9–13 DPI). Higher magnification insets corresponding to boxed region show HuC/D and DAPI, HuC/D and EdU, and all channels merged. Arrow indicates EdU+ HuC/D+ cell. (G) Percentage of HuC/D+ neurons that incorporate BrdU and EdU at the indicated timeframes (means ± s.d.) are similar to the percentages of PKCα+ BPs that incorporated these labels. Scale bar in B (applies to B,C,E,F) = 50 μm. Scale bar in insets (applies to all insets) = 10 μm.

