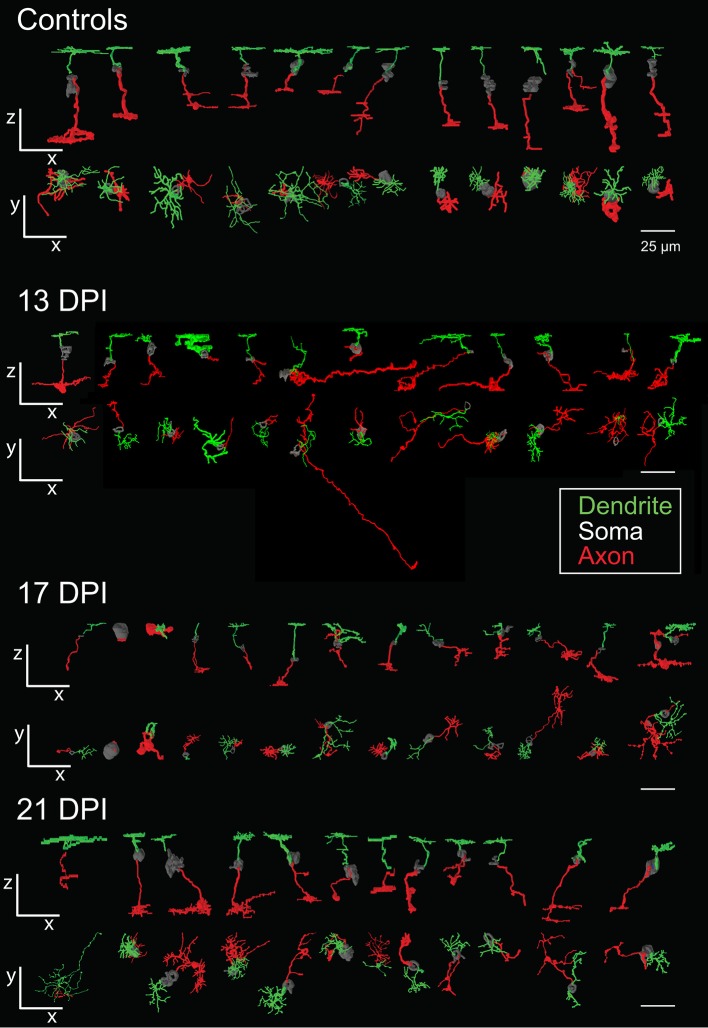
Figure 4.
Galleries of surface rendered nyx::mYFP+ retinal bipolar (BP) neurons. Neurons were traced in Simple Neurite Tracer (SNT), colorized, filled, created into three-dimensional surface models, imported into 3ds Max 2016, and then entered into a single image to display overall similarities and differences of BPs. For some BPs the cell body was not traced or only minimally traced due to limitations of SNT. Each timepoint shows the rendered neurons in the x-z radial “side” views (top row) and the x-y tangential “top-down” views (bottom row) relative to the imaging plane. BPs shown from control retinas included some that were also shown in McGinn et al. (2018). Dendritic tree alignment of the seventh 13 DPI neurons is offset vertically in order to fit all into the display without overlap. Scale bars = 25 μm. DPI, days post-injury.

