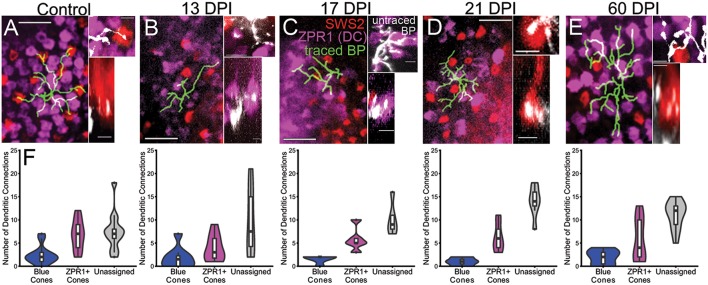
Figure 8.
Reestablishment of nyx::mYFP+ bipolar (BP) neuron dendritic connections with cone photoreceptor terminals. (A–E) Dendritic fields showing traced nyx::mYFP+ BPs (green) overlayed onto partial projections of blue-sensitive (red color) cone terminals and ZPR1+ (magenta color) red- and green-sensitive double cone terminals, from control (A), 13 days post-injury (DPI) (B), 17 DPI (C), 21 DPI (D), and 60 DPI (E) retinas. Control and 60 DPI images also appear in McGinn et al. (2018). Higher magnification views on right of each panel show untraced BP dendrites (white) forming connections with blue-sensitive (red color) and/or ZPR1+ (magenta color) red- and green-sensitive double cone terminals (Top images are z-projections; bottom images are partial projections from image stacks, showing resliced radial views; control and 60 DPI images also appear in McGinn et al. (2018), but with different pseudocoloring). (F) Distributions of dendritic connections to identified and unassigned photoreceptor subtypes for nyx::mYFP+ BPs in control, 13 DPI, 17 DPI, 21 DPI, and 60 DPI retinas. Shapes of violin plots were obtained by using a kernel density estimator to generate a smoothened histogram, mirrored along the x-axis, and then rotated. The width of each plot is determined by the proportion of bipolar cells making a given number of connections to that photoreceptor subtype at that point. In the boxplots within, the horizontal line inside each box represents the median, the top and bottom of the box represent the 25th and 75th percentiles, the whiskers represent the 1.5 interquartile range, and the filled circles represent outliers. Control vs. 13 DPI p = 0.3844, control vs. 17 DPI p = 0.2758, control vs. 21 DPI p = 0.031, control vs. 60 DPI p = 0.4534 (Generalized linear model). Scale bars in (A–E) = 10 μm for left panels, and 2.5 μm for right panels.

