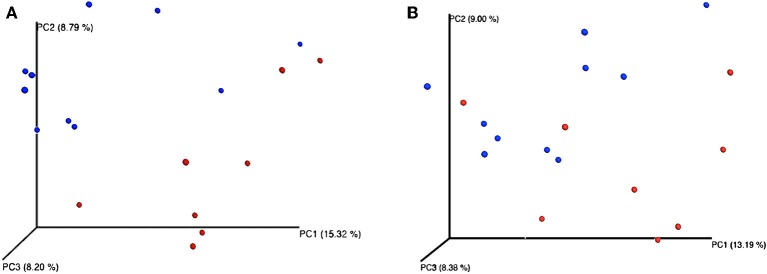
Figure 3.
Principal coordinates analysis (PCoA) representing β-diversity of both fecal (A) and nasal (B) bacterial communities in dairy calves. Figures were computed using unweighted Unifrac distances and a depth coverage of 17,300 sequences per sample. Bacterial communities from calves fed milk replacer (MR) (n = 8) are depicted in red, and those from calves fed pasteurized waste milk (pWM) (n = 10) in blue.

