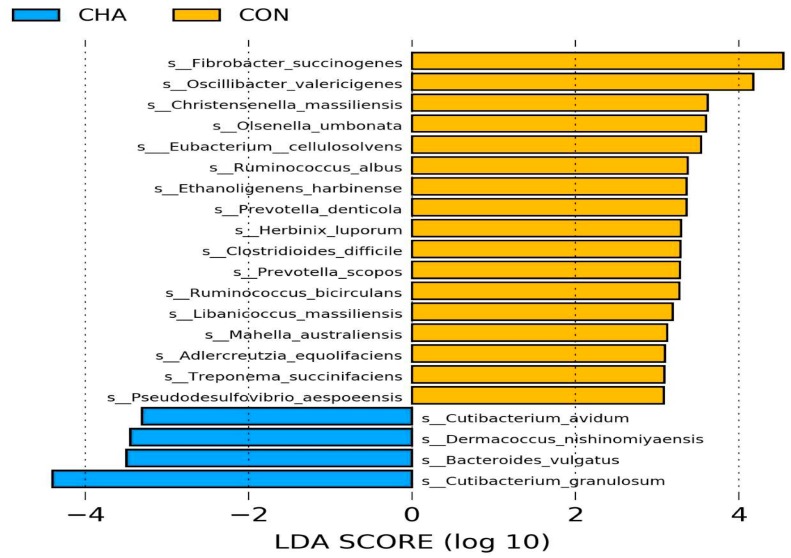
Figure 4.
Linear discriminant analysis effect size (LEfSe) of rumen microbiota in beef cattle during the acidosis challenge. CHA = corn-induced acidotic challenge, CON = control (no challenge). The plot indicates the differentially abundant transcriptomic active taxa found by ranking according to their effect size (≥ 2.0) at the species level. The taxa enriched in beef cattle fed the control diet (CON) are indicated with a positive score (yellow), and taxa enriched in the corn-induced acidotic challenge treatment (CHA) have a negative score (blue). Only taxa meeting the significant threshold of 2.0 are shown.

