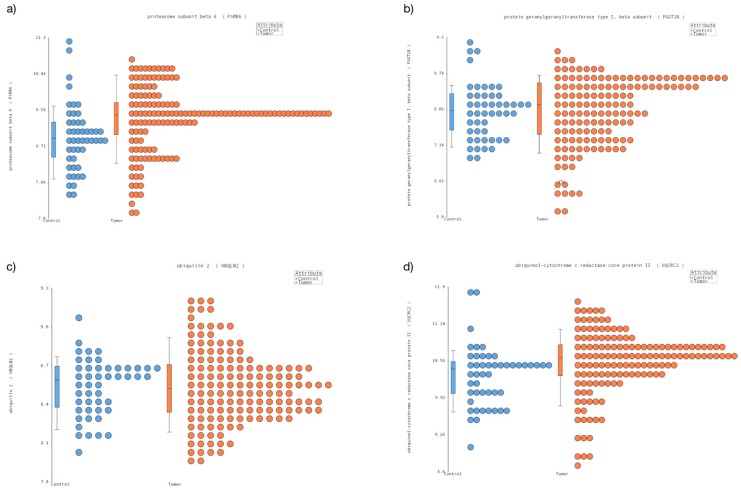
Figure 1.
Nonvarying genes were expressed in childhood cancer and healthy tissue. The dot plot shows the level of expression on the x axis. (a) PSMB6 (b) PGGT1B, (c) UBQLN2, (d) UQCR2. In the four transcripts, we observed homogenous expression between healthy tissues and cancer samples. The blue dots show the healthy tissue and the orange dots show the childhood cancer.

