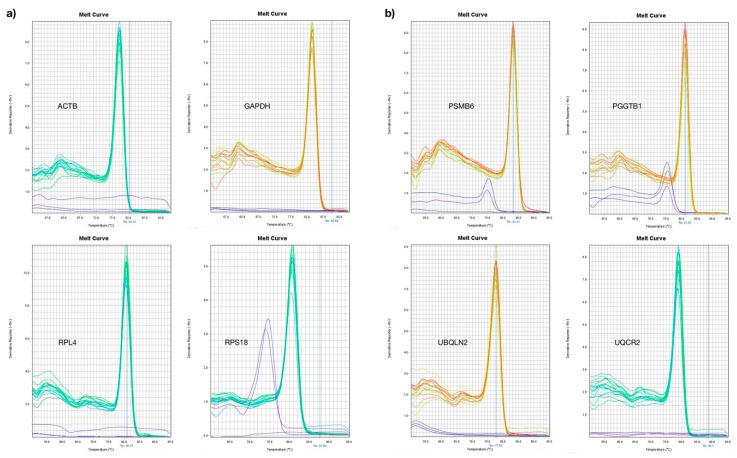
Figure 2.
Melting curves of the expressed nonvarying genes. (a) The classical reference genes ACTB, GAPDH, RPL4 and RPS18 are shown in the figure. We used five serial dilutions of cDNA SUP-B15 and we observed one curve as expected. Only RPS18 showed up as a different curve in the no-template control, probably due to primer dimers. (b) The plot shows the new reference genes PSMB6, PGGT1B, UBQLN2 and UQCR2. We observed one curve in the positive dilution. In PSMB6 and PGGT1B, we observed other curves in the no-template control, probably caused by primer dimers.

