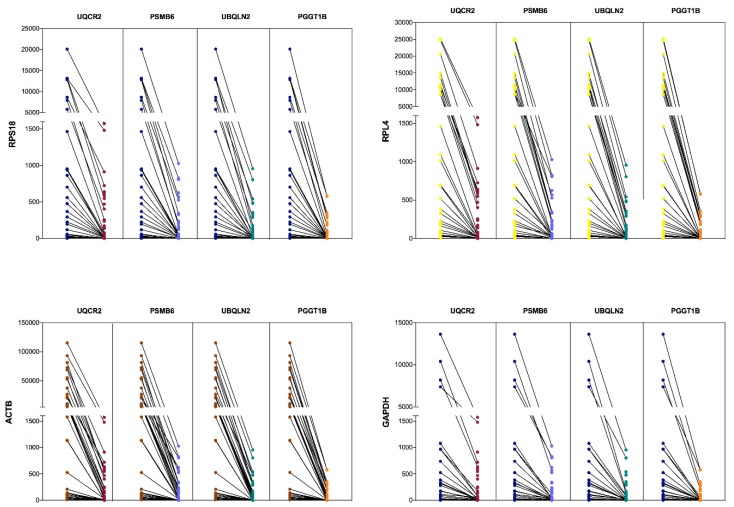
Figure 5.
The gene expression comparison between the classical reference versus new reference genes in ALL. The top left plot shows the expression level of the RPS18 gene versus UQCR2, PSMB6, UBQLN2 and PGGT1B. The top right shows the level of RPL4 gene expression versus UQCR2, PSMB6, UBQLN2 and PGGT1B. The lower left shows the expression levels of ACTB versus UQCR2, PSMB6, UBQLN2 and PGGT1B. The lower right shows the expression levels of the GAPDH gene versus UQCR2, PSMB6, UBQLN2 and PGGT1B.

