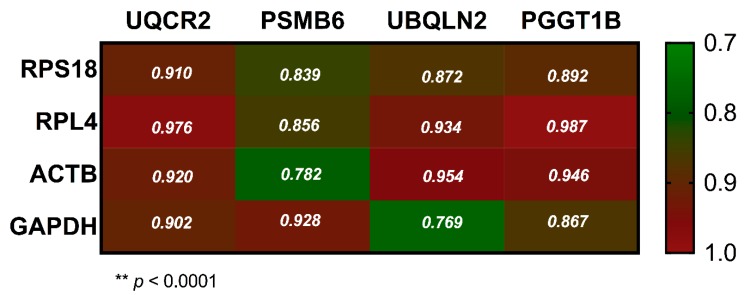
Figure 6.
Pearson’s correlations of the classical references versus new reference genes. We observed significant correlations p < 0.0001 for all transcripts evaluated. The correlation is shown at the intersection. We observed that UCQR2 and PGGT1B showed the best correlations with RPS18, RPL4 and GAPDH. The lowest correlation was observed between UBQLN2 versus GAPDH and PSMB6 versus ACTB with 0.769 and 0.782, respectively.

