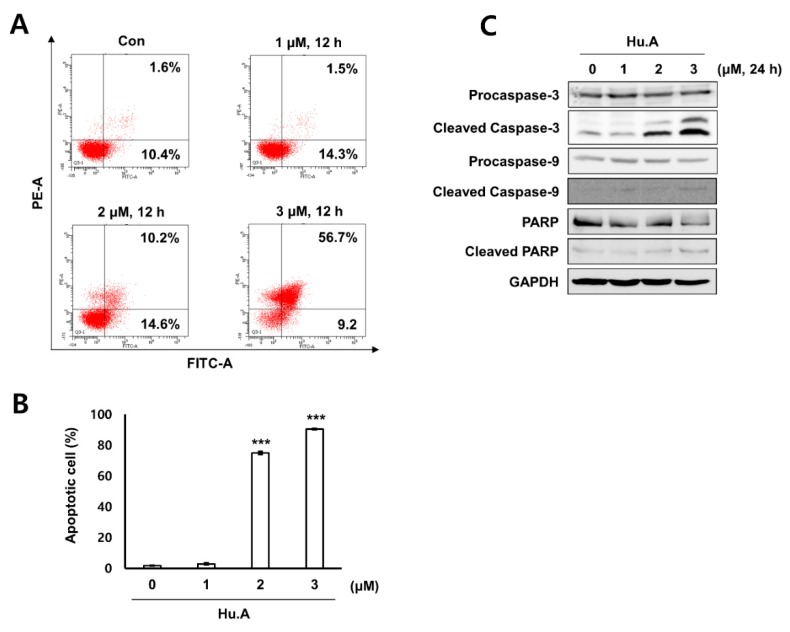
Figure 5.
Hu.A induced apoptosis in DLD-1 cells. (A, and B) The cells were stained with annexin V-PI and were analyzed using FACS. The data are shown as mean ± SD, respectively. ***, p < 0.01 compared with control. (C) The expression of caspase-3, caspase-9, and poly ADP-ribose polymerase (PARP) in the cells was analyzed by western blot assay. GAPDH was used as a loading control.

