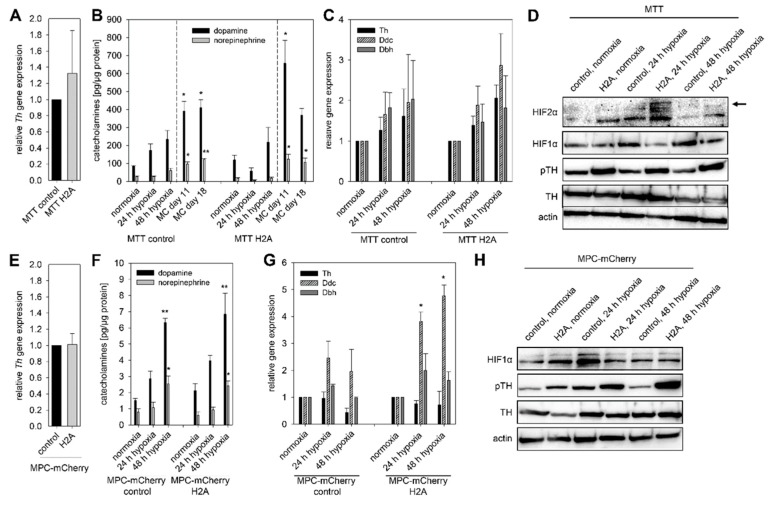
Figure 4.
Expression of Hif2α in mouse pheochromocytoma cells (pseudohypoxic conditions) enhanced the basal phosphorylation (pseudohypoxic conditions) of TH, which was further increased by the exposure to hypoxia. (A) Expression of Hif2α in MTT cells had no effect on the relative Th expression determined by qRT-PCR. Three independent experiments (n = 3). Mean ± SEM. (B) In both cell lines with different Hif2α expression, exposure to extrinsic or intrinsic hypoxia led to elevated DA and NEpi, especially in spheroids generated with the methyl cellulose (MC) method. Three independent experiments (n = 9). Mean ± SEM. ANOVA and Bonferroni post hoc test comparison vs. normoxia, * p < 0.05, or ** p < 0.01. (C) In MTT cells, expression of Th, Ddc and Dbh increased by the exposure to hypoxia independent of their Hif2α expression. Three independent experiments (n = 3). Mean ± SEM. (D) Pseudohypoxia, simulated by the expression of Hif2α as well as extrinsic hypoxia led to an enhance phosphorylation of TH at Ser40 in MTT cells. Representative sections of three independent Western blot analysis were shown. To confirm these results MPC-mCherry cells expressing Hif2α and their counterpart cell line were used. (E) Expression of Hif2α in MPC-mCherry cells had no impact on the relative Th expression. Six independent experiments (n = 6). Mean ± SEM. (F) Similar to MTT cells the exposure to hypoxia resulted in enhanced DA and NEpi in both MPC-mCherry cell lines. Three independent experiments (n = 9). Mean ± SEM. ANOVA and Bonferroni post hoc test comparison vs. normoxia, * p < 0.05, or ** p < 0.01. (G) Expression of Hif2α was associated with increased expression of Ddc under extrinsic hypoxia. Four independent experiments (n = 4). Mean ± SEM. ANOVA and Bonferroni post hoc test comparison vs. normoxia, * p < 0.05. (H) Western blot analysis confirmed the enhanced phosphorylation of TH at Ser40 under pseudohypoxic conditions in MPC-mCherry cells. Extrinsic hypoxia further increased this effect. Three independent experiments.

