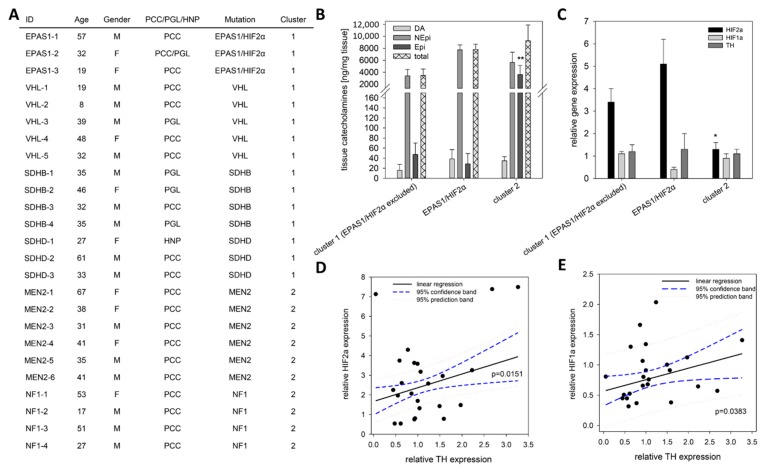
Figure 6.
Expression pattern of EPAS1/HIF2α, HIF1α and TH in human tumor tissue. (A) Clinical characteristics of the included patients with confirmed mutation in well-described cluster 1 or cluster 2 related genes. (B) Tumor tissue from patients carrying a somatic gain-of-function mutation in EPAS1/HIF2α (n = 3) showed twice as much NEpi than other cluster 1 tumors that is also reflected by the total amount of catecholamines (sum of DA, NEpi and Epi). An elevated content of Epi was observed for mature cluster 2 tumors in comparison to the immature cluster 1 tumors. Mean ± SEM. ANOVA and Bonferroni post hoc test comparison vs. cluster 1 and EPAS1/HIF2α, ** p < 0.01. (C) qRT-PCR analysis showed an elevated EPAS1/HIF2α expression in cluster 1 PPGLs; whereas the TH expression remains unaffected by the underlying mutations in the different cluster. Mean ± SEM. ANOVA and Bonferroni post hoc test comparison vs. cluster 1 and EPAS1/HIF2α, * p < 0.05. (D) A significant linear correlation between the expression of EPAS1/HIF2α and TH could be detected (f = 1.667 + 0.681x, r = 0.490, R2 = 0.2399). (E) A similar correlation was also observed for the expression of HIF1α and TH (f = 0.566 + 0.190x, r = 0.4252, R2 = 0.1808).

