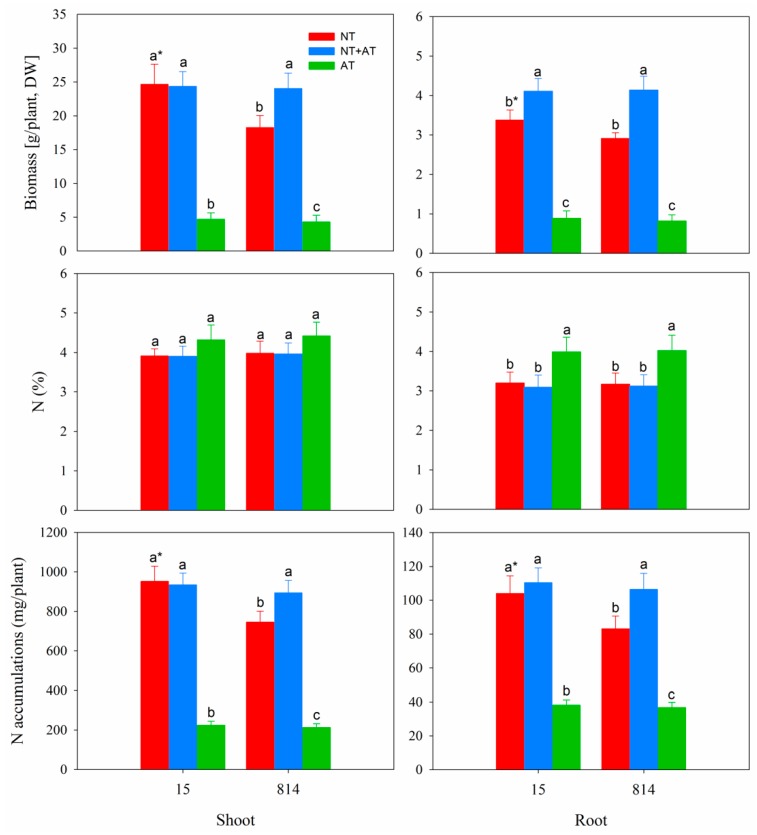
Figure 1.
Growth performances of two cultivars, namely, 15 (high N efficiency) and 814 (low N efficiency), after 70 d in different N treatments. The three treatments contained the same amount of N (15 mmol/L). Different letters at the top of the histogram bars denote significant differences among treatments for the same cultivar (p < 0.05); asterisks (*) at the top of the histogram bars denote significant differences between cultivars in the same treatment (p < 0.05); vertical bars indicate the standard deviation (SD) (n = 5).

