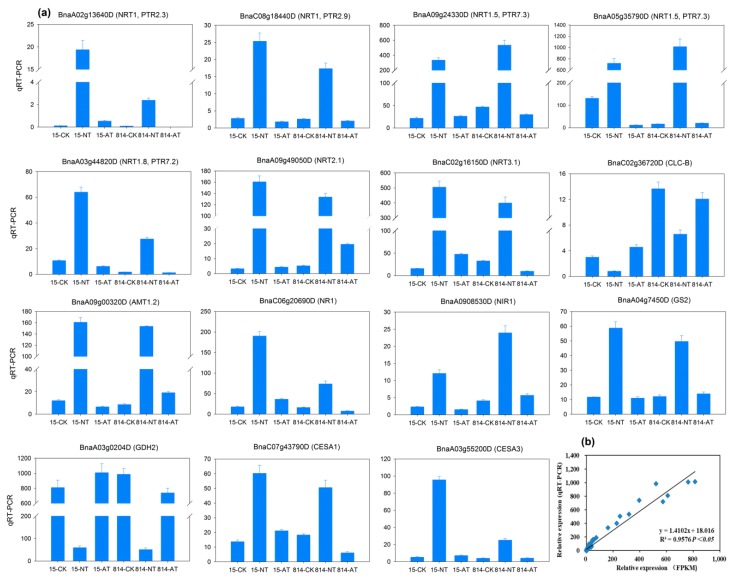
Figure 7.
Quantitative real-time PCR (qRT-PCR) validation of 15 differentially expressed genes (DEGs). (a) Transcript levels of 15 DEGs. Vertical bars indicate SDs (n = 3). The columns represent relative expression obtained by qRT-PCR. (b) Comparison of relative expression obtained from RNA-Seq data and qRT-PCR. RNA-Seq relative expression (x-axis) is plotted against qRT-PCR relative expression (y-axis). The correlation coefficient (R2) is indicated in the figure. FPKM: fragments per kilobase of exon per million fragments mapped.

