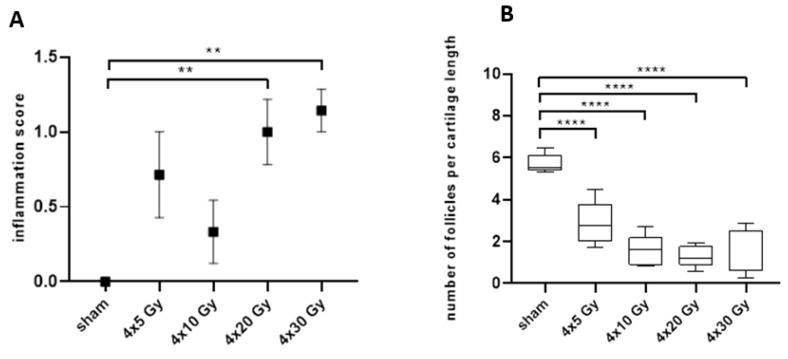
Figure 5.
Semi-quantitative analysis of the inflammation score (A) and quantification of hair follicle profiles within pre-defined region of interest. (B) in histological sections of irradiated ears on day 92 after sham-irradiation or a 4-fraction course with doses of 5 Gy, 10 Gy, 20 Gy and 30 Gy per fraction. One-way ANOVA with Kruskal-Wallis test and Dunn’s post hoc test was used for statistical analysis. Asterisks indicate significant differences: ** p ≤ 0.01, **** p ≤ 0.0001.

