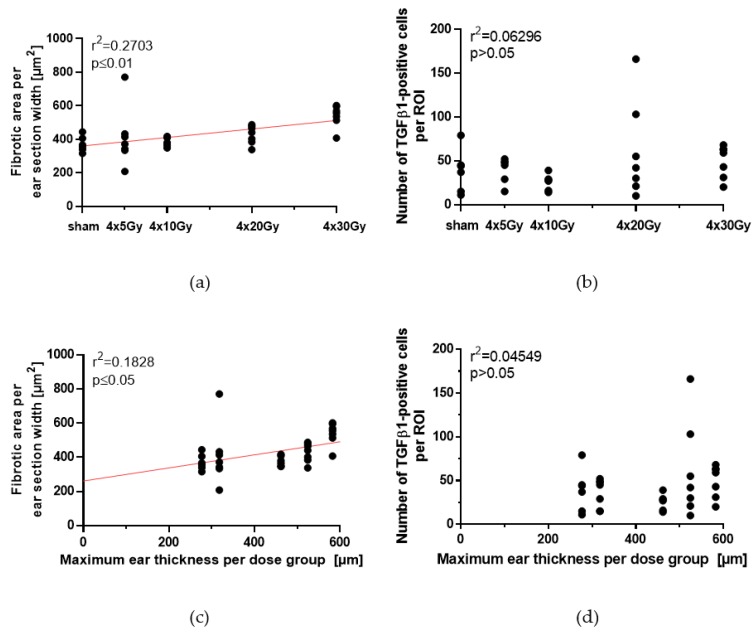
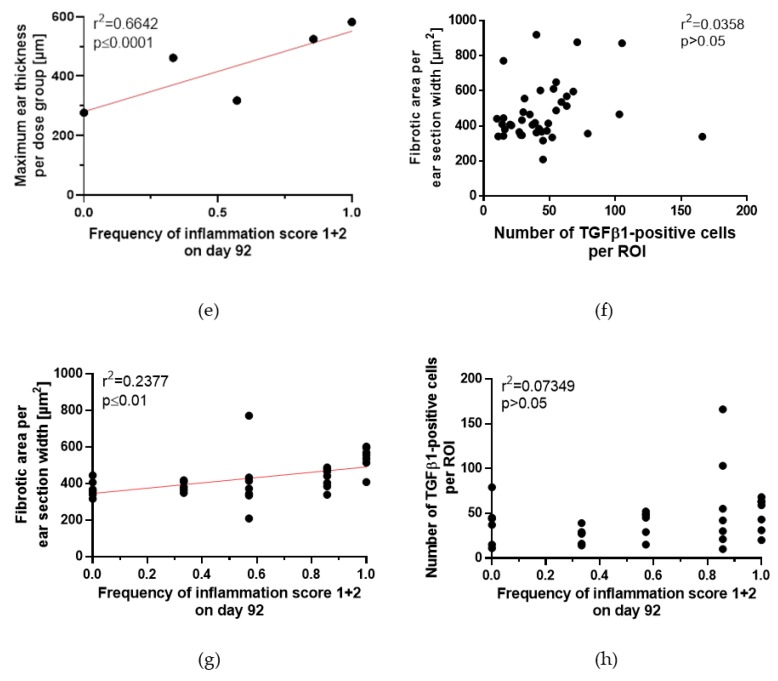
Figure 9.
Quantification of the fibrotic area and the abundance of TGFβ1-expressing cells in ear sections on day 92 following a 4-fraction course with different doses per fraction. Collagen was stained by Sirius red and TGFβ1-expressing cells were identified by immunohistochemistry and quantified within the pre-defined ROI, using automated digital image analysis. (a) Correlation of the fibrotic area on day 92 with the dose per fraction. (b) Correlation of the number of TGFβ1-expressing cells on day 92 with the dose per fraction. (c) Correlation of the fibrotic area with the maximum ear thickness during the acute reaction (see Section 2.2, Table 2). (d) Correlation of the number of TGFβ1-expressing cells on day 92 with the maximum ear thickness during the acute reaction (see Section 2.2, Table 2). (e) Correlation between the maximum ear thickness as acute reaction (see Section 2.2, Table 2) and the frequency of both inflammation score 1 and 2 in all animals on day 92. (f) Correlation between fibrotic area and number of TGFβ1-postive cells. (g) Correlation between fibrotic area and the frequency of both inflammation score 1 and 2 in all animals on day 92. (h) Correlation between number of TGFβ1-expressing cells and the frequency of both inflammation score 1 and 2 in all animals on day 92. Correlations were calculated using Spearman’s correlation with linear regression. Significance p-values are indicated.


