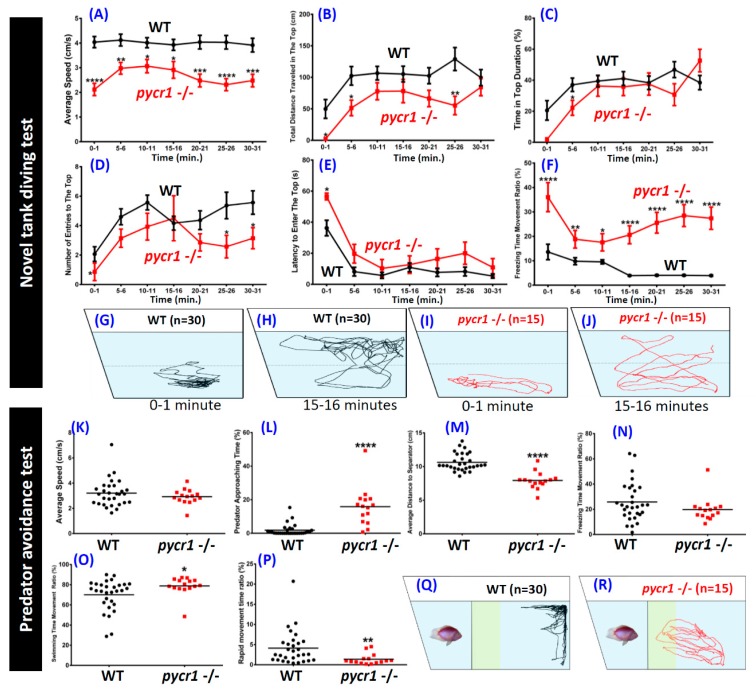
Figure 4.
Comparison of behavioral endpoints in novel tank exposure test and predator avoidance test in wild type and pycr1 gene knockout (KO) zebrafish. (A) Average speed, (B) total distance traveled in the top area, (C) duration time in the top of the tank, (D) number of entries to the top, (E) latency to entry to the top, (F) freezing time to movement ratio, (G) and (H) locomotion trajectories of wild type (WT) fish before and after acclimation, respectively, (I) and (J) locomotion trajectories of the pycr1 KO fish before and after acclimation, respectively. (K) Average speed, (L) predator approaching time, (M) average distance to separator, (N) freezing time to movement time ratio, (O) swimming time to movement time ratio, (P) rapid movement time ratio of WT and pycr1 KO fish. The data for novel tank test (A–F) were expressed as the mean ± SEM and analyzed by unpaired t-test (WT n = 30; pycr1 KO n = 14; * p < 0.05; ** p < 0.01; *** p < 0.001; **** p < 0.0001). The data for the predator avoidance test (K–P) were expressed as the mean and analyzed by Mann–Whitney test (control n = 30; pycr1 KO n = 15; * p < 0.05; ** p < 0.01; **** p < 0.0001). (Q) and (R) locomotion trajectories the of WT and pycr1 KO fish, respectively.

