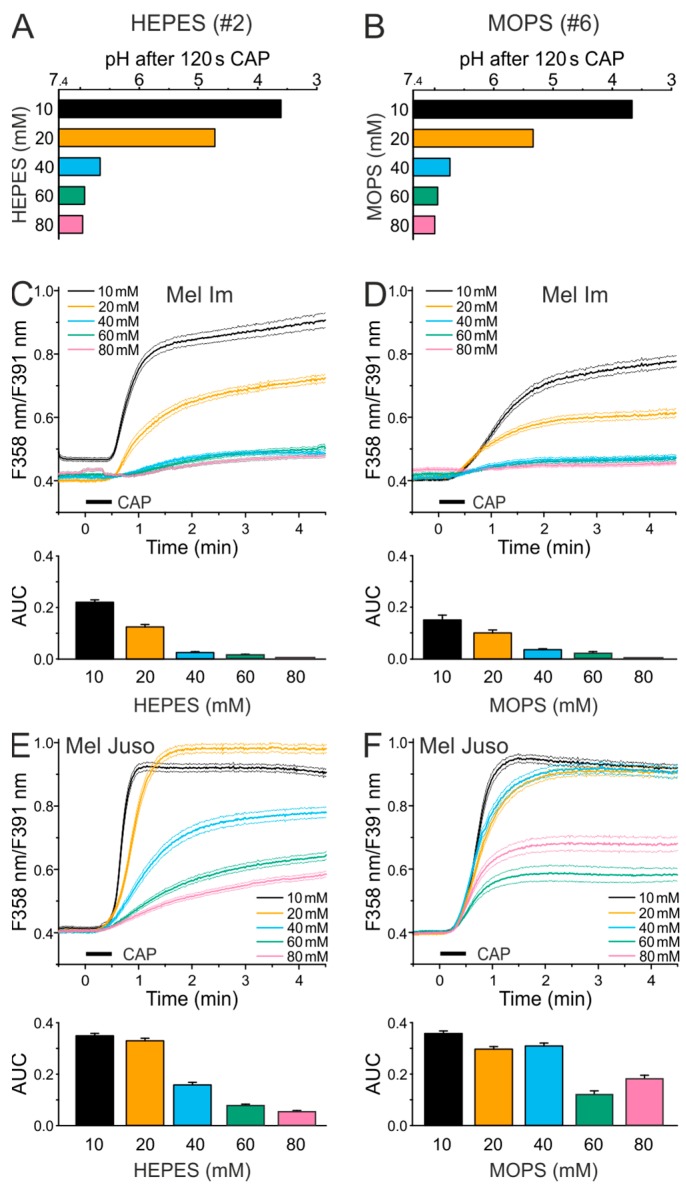
Figure 2.
CAP-induced Ca2+ influx decreases in Mel Im and Mel Juso cells with increasing buffer concentration. Experiments in HEPES-buffered solutions are reported in the left panels (A,C,E), the respective experiments in MOPS-buffered solutions in the right panels (B,D,F). (A,B) Measurement of the pH of different HEPES- (A) and MOPS- (B) buffered solutions (7 × 20 µL) after 120 s CAP treatment, using a 1.5 mL reaction vessel. Data are shown as mean. (C–F) Cytoplasmic Ca2+ levels stimulated by 30 s CAP exposure of Mel Im (n = 220–603) and Mel Juso (n = 223–377) cells in different HEPES- (C,E) and MOPS- (D,F) buffered solutions.

