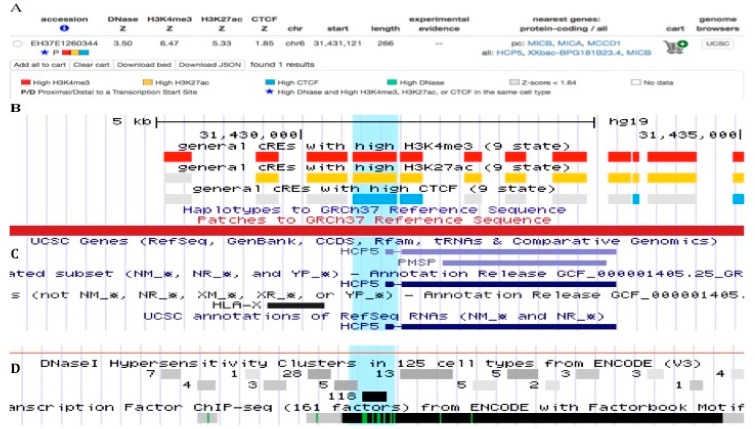
Figure 4.
CTCF-binding sites proximal to and within the HCP5 gene. (A) ENCODE accession number (EH37E1260344) and statistical scores for presence of binding sites for CTCF, H3K4me3, and H3K27ac and DNaseI hypersensitivity clusters. (B) The ENCODE regulation tracking details from the UCSC genome browser (Table S1) show the CTCF locations (blue horizontal blocks on line 3) relative to (C) the HCP5 and HLA-X gene positions below the horizontal red line. In (B) the cREs with a high probability for binding H3K4me3 are the red blocks on line 1, and those with high probability for binding H3K27ac are the yellow blocks on line 2. (D) The location of the DNaseI hypersensitivity clusters and 161 transcription factor binding sites from ChIP-seq data analysis archived in ENCODE are shown below the HLA-X and HCP5 genes.

