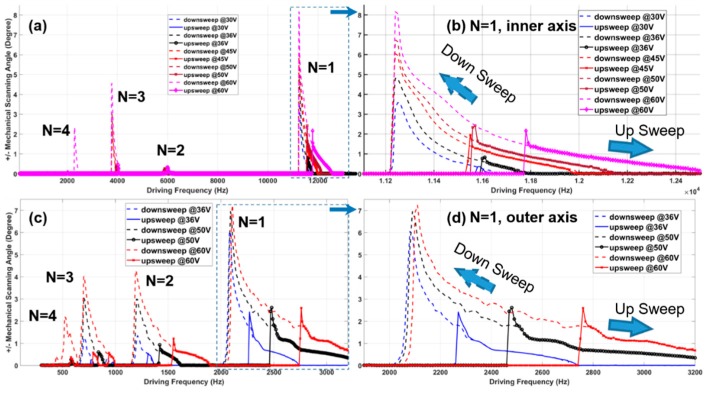
Figure 7.
Characterization of the parametrically-resonant scanner on both inner (fast) and outer (slow) axes. (a) Tilting amplitude (mechanical scanning angle (MSA), units: degrees) vs. driving frequency sweeping (from 1 Hz–13k Hz, in ambient air, with variant driving voltage from 30 V–60 V) of the inner (fast) axis (N = 1–4); (b) zoom-in view of the response curves of the inner (fast) axis while N = 1; (c) tilting amplitude vs. driving frequency sweeping (from 1 Hz–3500 Hz) of the outer (slow) axis (N = 1–4, in the ambient air at room temperature, with variant driving voltage from 36 V–60 V); (d) zoom-in view of the response curves of the outer axis for N = 1. Note: while N = 1, the driving frequency is double the resonant scan frequency.

