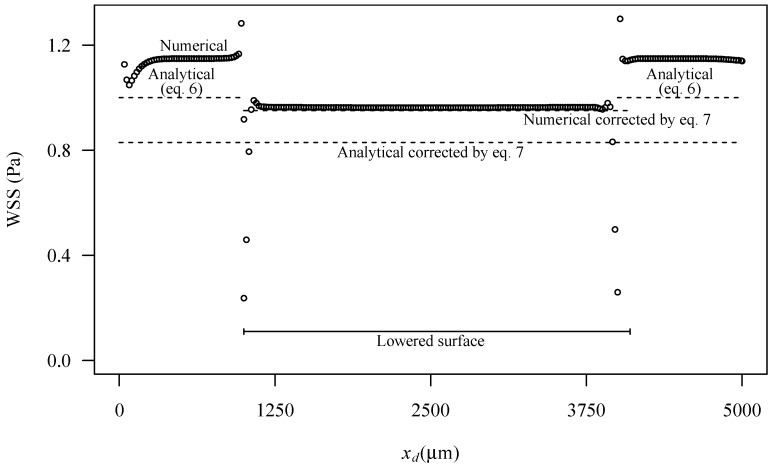
Figure 11.
Wall shear stress along the centreline at the bottom surface in the lowered region for a nominal wall shear stress of 1 Pa. Figure shows numerical predictions (symbols), predictions based on analytical Equation (6) and predictions with corrections based on Equation (7). Local domain coordinates are used to represent the distance from the domain inlet.

