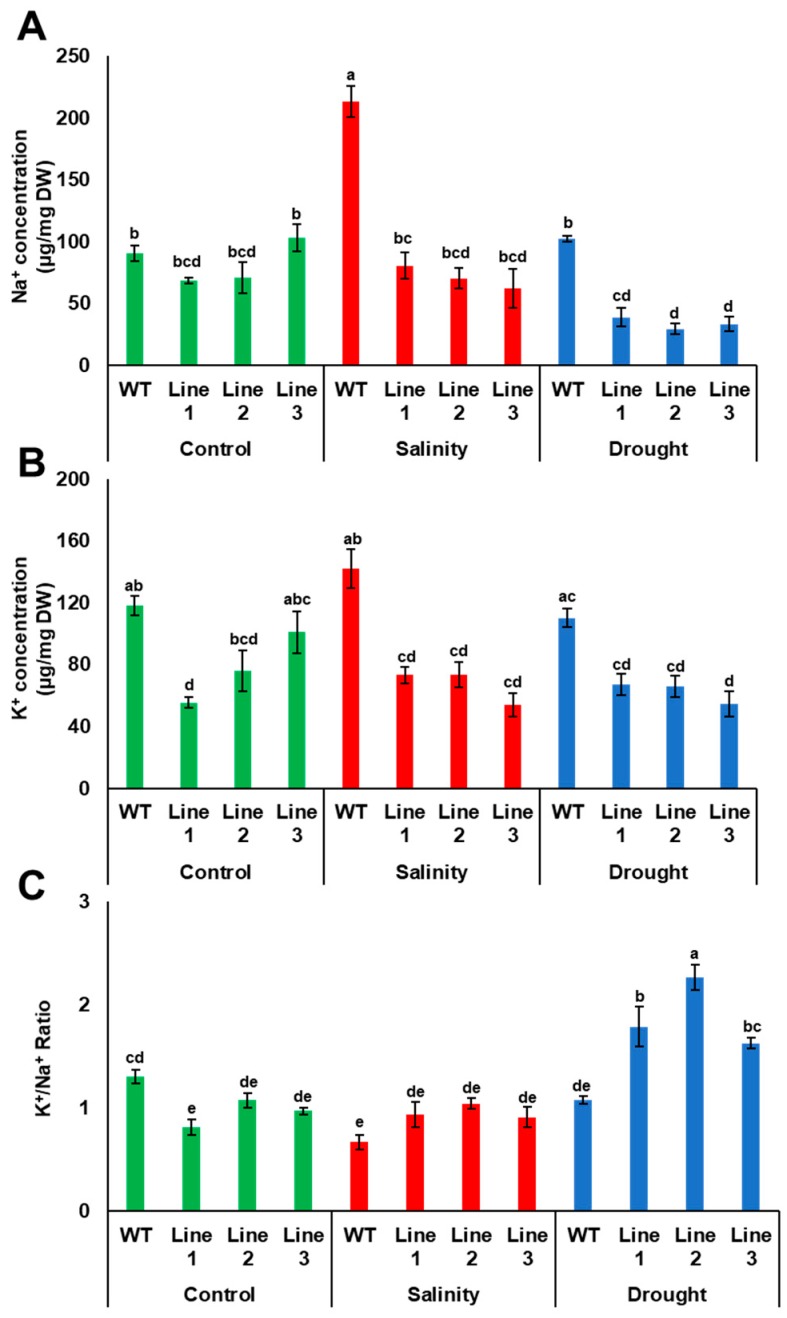
Figure 9.
Accumulation of Na+ and K+ in transgenic Arabidopsis plants. Na+ (A) and K+ (B) concentrations and the K+/Na+ ratio (C) in WT and transgenic Arabidopsis lines with PdPIP1;2 subjected to drought (150 mM mannitol) and salinity (100 mM NaCl) on half-strength MS medium plates. The bars represent the mean concentrations of Na+ and K+ (± SE, n = 3), while the asterisks indicate a significant difference to WT at p < 0.05.

