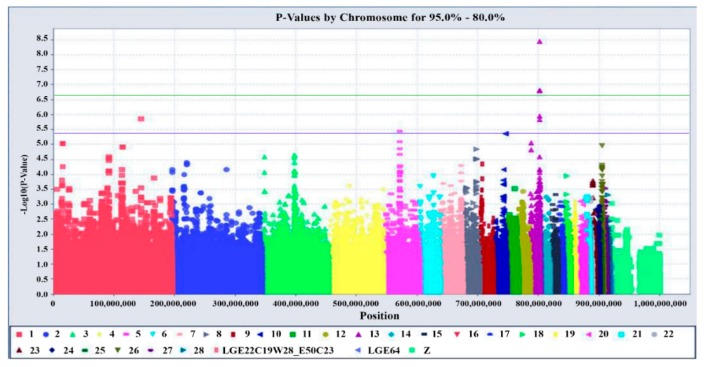
Figure 1.
The Manhattan plot shows the association of single nucleotide polymorphisms with egg production traits. Each dot represents one SNP. The figure illustrated the level of statistical significance (y-axis), as measured by the negative log of the corresponding p value for each single nucleotide polymorphism (SNP). Each typed SNPs indicate dots of different colors, which are arranged by chromosomal location (x-axis). Imputation was performed on chromosome 13 using only the data of 120 genomes. The highlighted green line indicates the threshold of 5% Bonferroni genome-wide significance (p = 2.09 × 10⁻⁷), and the underlined blue line shows the limit of symbolic genome-wide significance (p = 4.18 × 10⁻⁶), respectively.

