Figure 2.
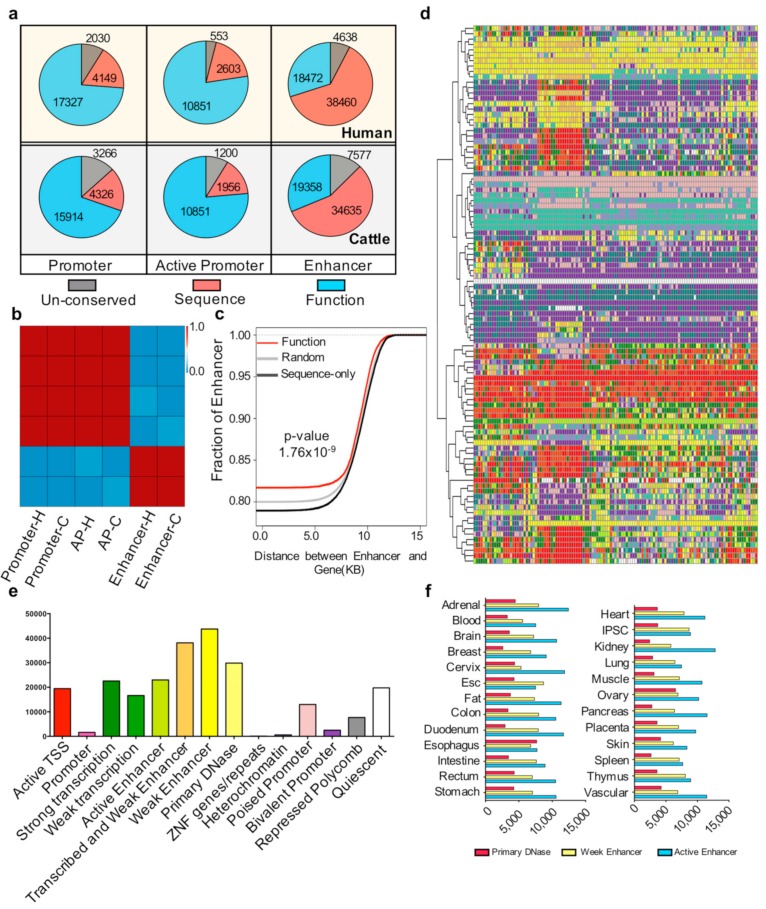
Conservation of cis-regulatory elements (a) Number of pig un-conserved, sequence-only conserved, and functionally conserved elements with humans and cattle in the promoter, active promoter, and enhancer regions. (b) Heatmap of the Pearson correlation coefficient among the three types of conservation state elements. Three types of conservation state elements were un-conserved, sequence-only conserved, and functionally conserved with humans and cattle in the promoter, active promoter, and enhancer regions. H and C indicate pig elements conserved with humans and cattle, respectively. (c) Cumulative distribution of the distance of random, sequence only, and functionally conserved enhancers to gene sites. The red, black, and gray lines represent the functionally conserved elements, sequence-only conserved elements, and randomly selected 100 times and selected 4000 elements each time. The p-value was determined by the Kolmogorov-Smirnov (KS) test between functionally conserved enhancers and sequence-only conserved enhancers. (d) Chromatin states of sequence-only conserved elements in the Roadmap ChromHMM imputation profile. The k-means cluster method (k = 100) was used; each row represents one cluster. For the number of elements in each row and the tissue type in each column, see Supplementary Materials Table S6. The color scale follows the ChromHMM and Roadmap imputation default parameters (Supplementary Materials Table S6). (e) Distribution of sequence-only conserved elements that play roles in different chromatin states in the human genome. (f) Numbers of primary DNase, weak enhancer, and active enhancer have been imputed in different human tissues.

