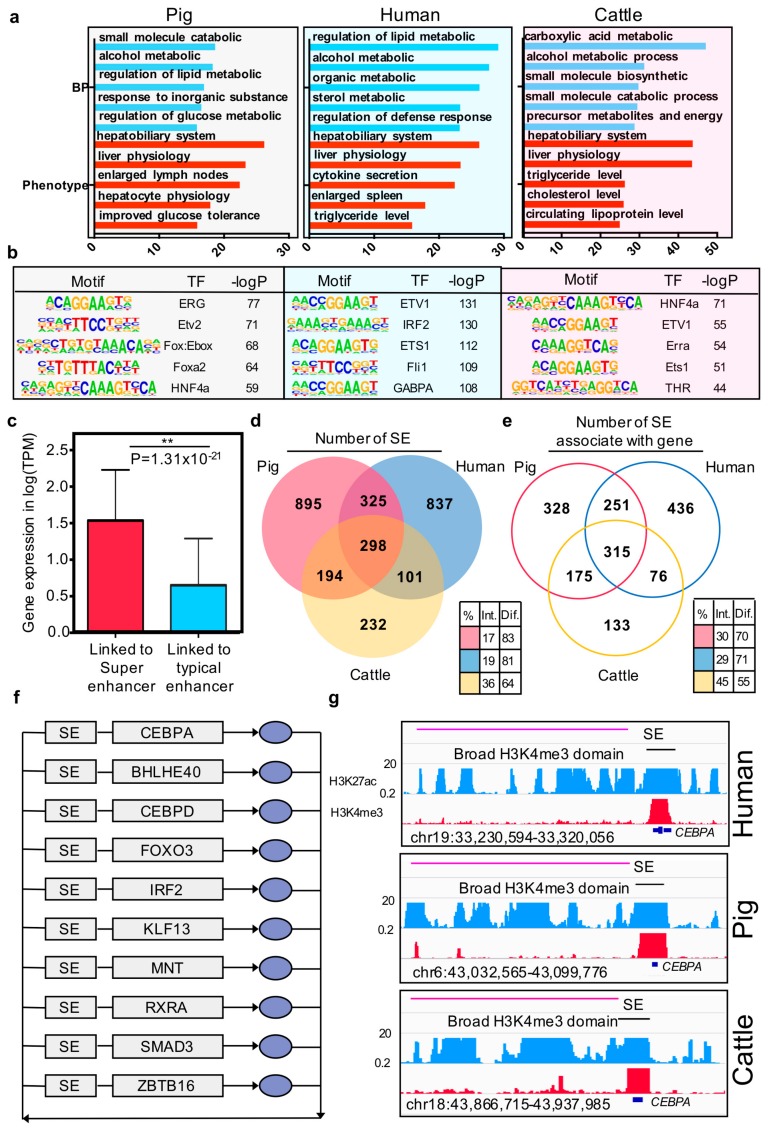
Figure 4.
Characteristics of super and typical elements in three mammals. (a) Enriched Gene Ontology terms and phenotype terms for the top 3000 enhancers ranked by H3K27ac intensity in pigs, humans, and cows. The y-axis represents the –log p-value; (b) Enriched TF binding motifs with associated p-values for top 3000 enhancers in pigs, humans, and cows; (c) The bar plot of the gene expression (log TPM) at the linked genes of super-enhancer and typical enhancer. * p-value = 4.81 × 10⁻¹⁷ (Wilcoxon rank-sum test). (d) Venn diagram showing the number of functional conserved super-enhancers across pigs, humans, and cows. (e) Venn diagram showing the number of orthologous genes associated with super-enhancers in pigs, humans, and cows. Color-coded tables show the percentages of intersection and difference for each species. The observed differences in intersection between super-enhancer elements and super-enhancer associated with genes in the three species are significant (p-values = 1.66 × 10⁻¹⁶) based on G-tests of independence. (f) Overlapping transcriptional core regulatory circuitry (CRC) cross liver tissues of three species. The grey rectangles represent super-enhancers (SEs) and genes, and the blue oval symbols represent the proteins. (g) ChIP-seq, H3K4me3, and H3K27ac profiles of representative conserved broad H3K4me3 domain and super-enhancer located in one of the transcriptional core regulatory circuitry transcription factor CEBPA region in the three species.

