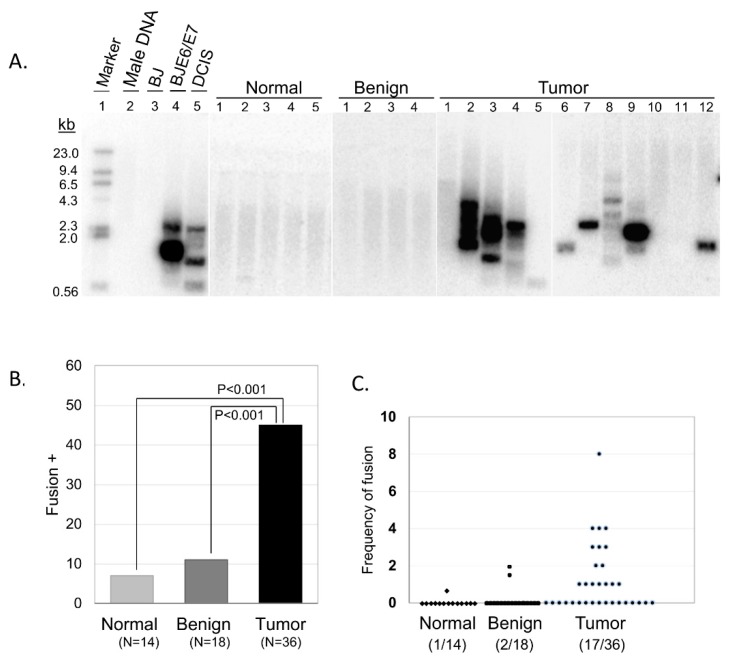
Figure 1.
Telomere fusions in the ovarian tissue samples. (A) Southern blot analysis using 32P-labled [TTAGGG]4 probe. Five representative samples are shown for normal and benign, and 12 for tumor tissue samples. Normal male DNA and BJ foreskin fibroblast cells are used as negative controls, while BJ cells expressing the human papillomavirus type 16 E6/E7 oncoproteins (BJ E6/E7) DNA and ductal carcinoma in situ (DCIS) DNA are used as positive controls. (B) The percentage of fusion-positive samples. Standard t-test analysis is shown. (C) Frequency of telomere fusions where each dot represented one individual with the number of telomere fusion Southern bands per 500ng genomic DNA from five TAR-Fusion PCRs.

