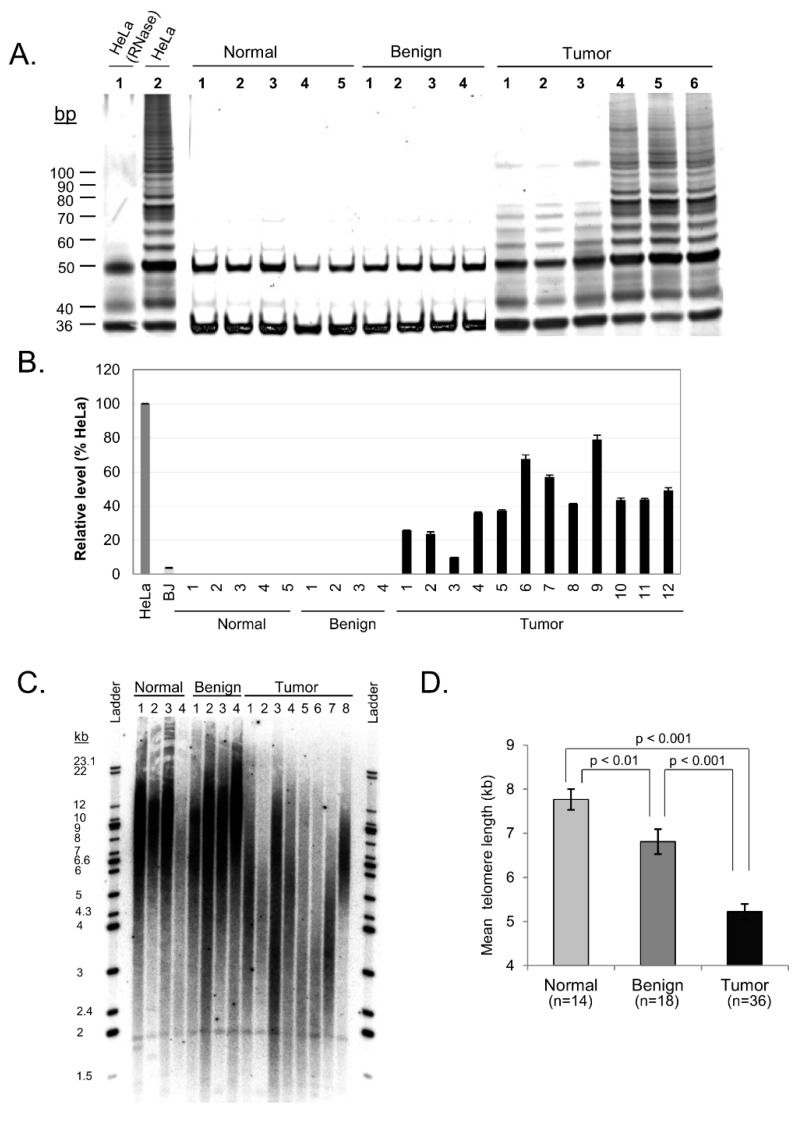
Figure 3.
hTERT, telomerase, and telomere length profiles of ovarian carcinoma tissue samples. (A) Representative samples with telomerase activity in ovarian carcinoma. Fresh lysates of HeLa cells were used as positive control for telomerase activity while heat treated HeLa cells with inactivated telomerase serve as negative control. (B) Representative samples of hTERT expression levels in ovarian carcinoma quantified. HeLa and BJ cells were used as positive and negative controls respectively. (C) Representative Southern Blot of telomere length comparing normal, benign and tumor ovarian tissue. (D) Quantified mean telomere length (kb) of normal, benign and tumor tissue samples (mean ± SE). Standard t-test analysis is shown.

