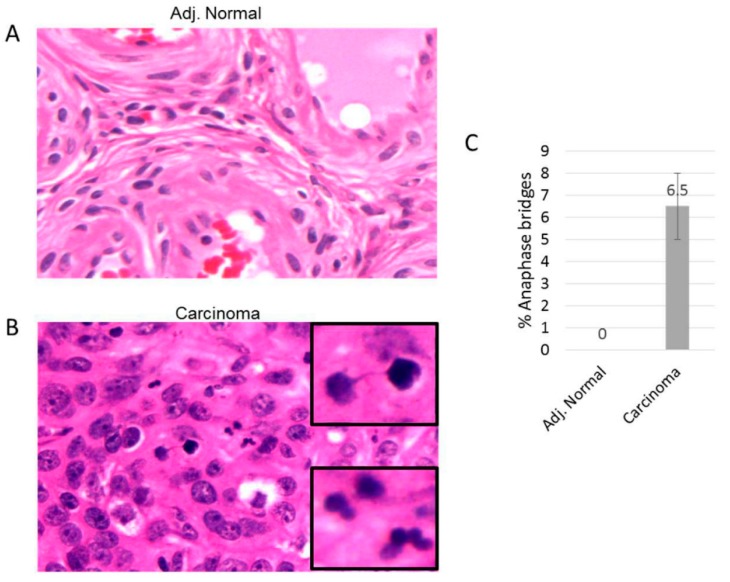
Figure 4.
Anaphase bridge analysis in ovarian carcinoma. Tissue sections are stained with Hematoxylin and Eosin (H&E). (A) and (B) are representative adjacent tissue and ovarian carcinoma tissue sections, respectively. (C) The percent of anaphase bridges was calculated from the total anapases within each ovarian carcinoma.

