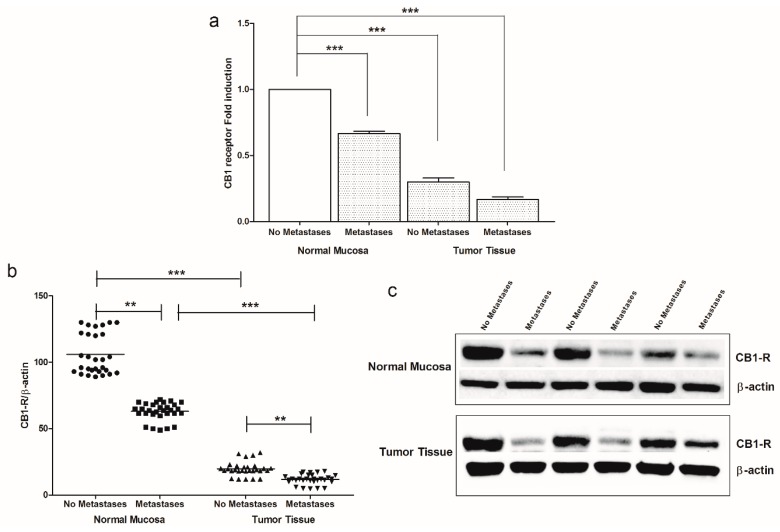
Figure 1.
(a) CB1 receptor gene expression levels in intestinal tissue of no metastases (n = 29 patients) and with metastases patients (n = 30 patients) detected in both normal mucosa and tumor tissue. Data, expressed as mean value ± SD, are presented as fold induction compared to normal mucosa of patients without metastases. (b) Dot plots graph of CB1 receptor protein values detected in our patients groups. ** p < 0.02, *** p < 0.001 indicate statistically significant differences (one-way analysis of variance with Dunnett’s and Tukey’s multiple comparison test, where appropriate). (c) Representative Western blot bands of CB1-R and β-actin proteins. All Western blot figures include a dot plots graph showing the densitometry values of each sample (band) normalized to β-actin value. The whole blot has been provided as Supplemental Materials (Figure S1).

