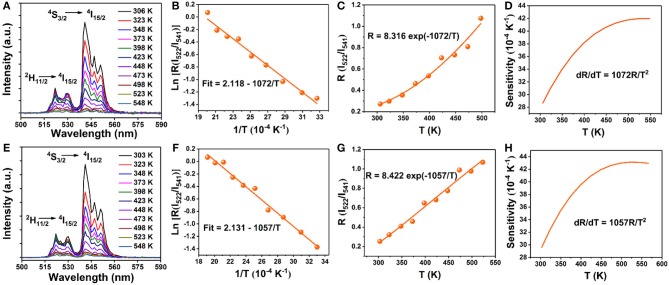
Figure 6.
Temperature dependent (303–548 K) normalized UC emission spectra of the (A) 0 mol% Mn; (E) 5 mol% Mn doped NaGdF4: Yb/Er samples in the wavelength range of 500–590 nm; (B,F) Monolog plots of FIR as a function of inverse absolute temperature; (C,G) The FIR of NaGdF4: Yb/Er and NaGdF4: Yb/Er/5 Mn phosphors as a function of temperature based on 2H11/2/4S3/2 levels; (D,H) The relative sensitivity (SR) vs. absolute temperature.

