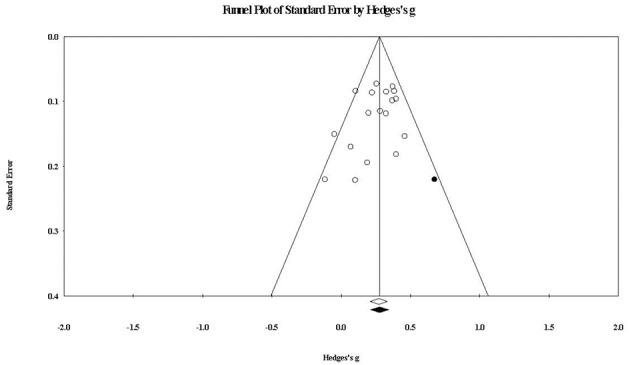
Figure 7.

Funnel plot of standard error by within-group overall youth outcomes effect sizes. The black circle represents the effect size of the imputed study that would be required to remove publication bias. The white diamond represents the observed summary effect size, while the black diamond represents the imputed summary effect size free of publication bias.
