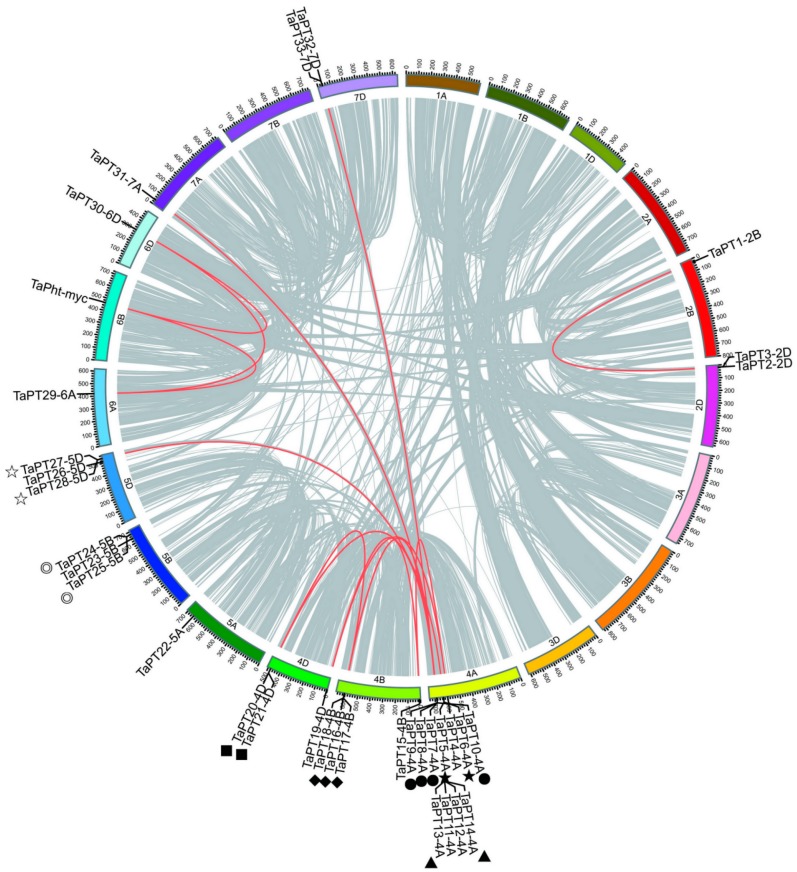
Figure 3.
Chromosomal positions and synteny relationships of the PHT1 genes in the wheat genome. All syntenic blocks (more than 300 anchor genes) and genes are linked by the grey lines, and segmental duplication pairs of TaPHT1 genes are highlighted by red lines. Different symbols indicate seven tandem regions.

