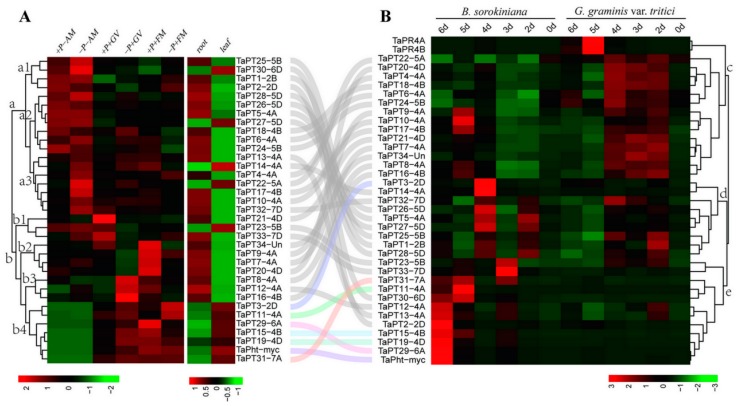
Figure 4.
Expression profiles of 35 TaPHT1s under indicated treatments. (A) TaPHT1s expression patterns in roots colonized with two varieties of AM fungi after six weeks in high and low phosphorus conditions (left panel); TaPHT1 genes’ expression patterns in roots and leaves of non-symbiotic 6-weeks-old seedlings (right panel). (B) TaPHT1s expression patterns in roots infected by Ggt and B. sorokiniana at 0–6 dpi.

