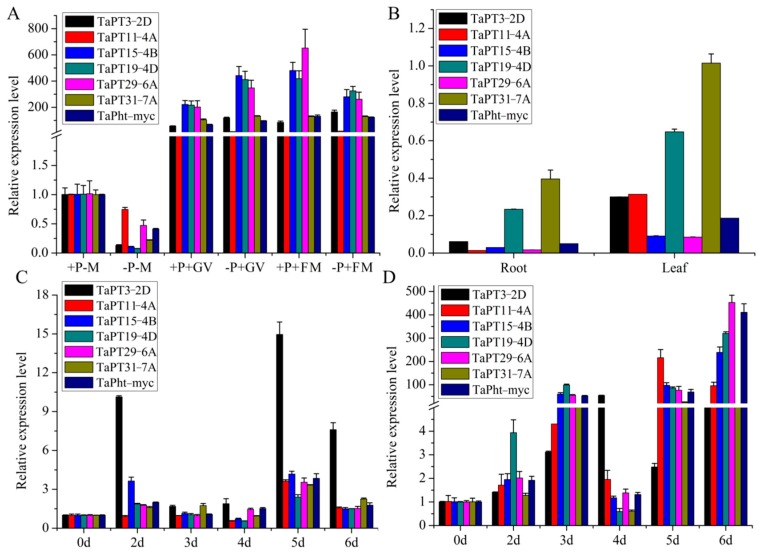
Figure 5.
Results of real-time RT-PCR analysis of the seven mycorrhiza-inducible TaPHT1s under indicated treatments. (A) Expression levels of seven TaPHT1s in roots inoculated with AM fungi after six weeks in low and high phosphorus conditions. (B) Expression of TaPHT1s versus the actin gene in roots and leaves of non-symbiotic 6-weeks-old seedlings. (C) TaPHT1 expression levels in roots infected by Ggt at 0–6 dpi. (D) TaPHT1 expression level in roots after inoculation with B. sorokiniana at 0–6 dpi. Bars indicate means of three biological replications with standard errors.

