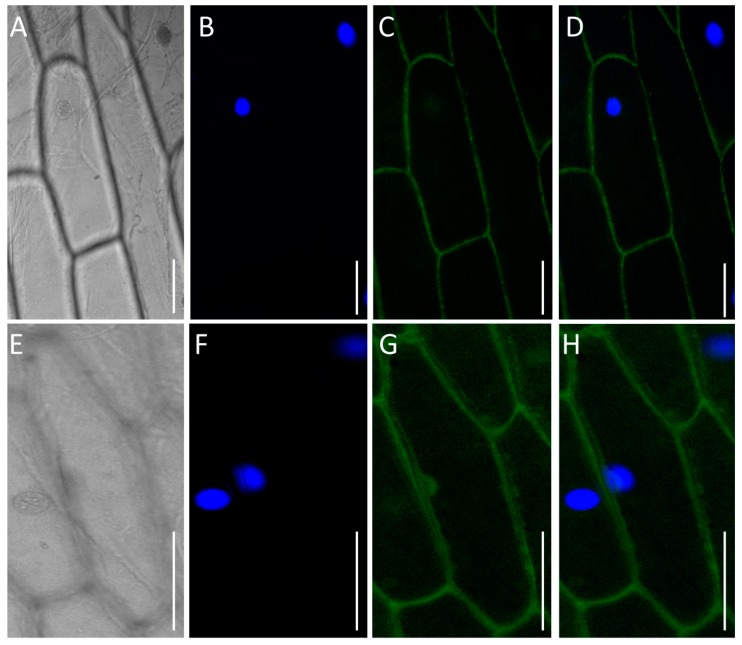
Figure 6.
Subcellular localization of TaPT29-6A/GFP protein. Images showing onion epidermal cells expressing TaPT29-6A/GFP (A–D) and empty vector (E–H). Bright field illumination (A,E); DAPI-stained nuclei (B,F); UV excited fluorescence images (C,G); merged images of DAPI and fluorescence (D,H). Scale bar = 25 µm.

