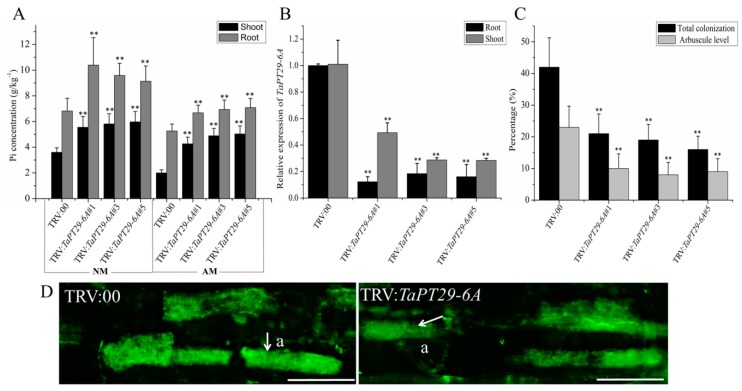
Figure 7.
Arbuscular mycorrhizal phenotypes of TaPT29-6A-silenced plants. Fluorescence microscopic images showing arbuscules in wheat roots silenced with a TaPT29-6A partial sequence and controls infected with the TRV:00 vector. (A) Pi concentrations in indicated tissues of TaPT29-6A-silenced and control plants in the presence and absence of F. mosseae at 42 dpi. (B) Relative transcript levels of TaPT29-6A in control and silenced plants. Bars indicate means of three biological replicates with standard errors. (C) Levels of F. mosseae colonization and arbuscules at 42 dpi in TaPT29-6A-silenced and control plants. (D) Wheat roots of TaPT29-6A-silenced and control plants stained with WGA-Alexafluor 488 to view F. mosseae arbuscules in their cells at 6 wpi. Double asterisks indicate significant differences relative to TRV:00 plants (P ≤ 0.01 according to t tests). a = arbuscules. Bars = 12.5 µm. NM, non-colonized; AM, colonized.

